
All OJJDP publications may be viewed and downloaded on the publications section of the OJJDP website. Print publications may be ordered online at the National Criminal Justice Reference Service website.

 Studying Drivers of Risk and Needs Assessment Instrument Implementation in Juvenile Justice (Bulletin)
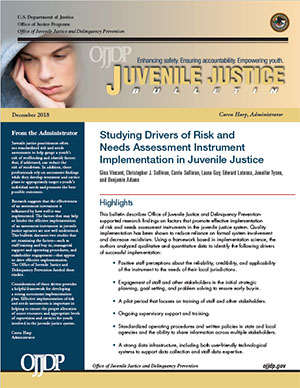
NCJ 251809
Juvenile justice practitioners often use risk and needs instruments to assess a youth’s risk of reoffending and identify factors that, if addressed, can reduce the risk of recidivism. In addition, these professionals rely on assessment findings to develop a treatment and service plan that will appropriately target a youth’s individual needs and promote the best possible outcomes. Research suggests that the effectiveness of an assessment instrument is influenced by how well it is implemented. This bulletin examines two OJJDP-supported studies that examine the factors—such as staff training and buy-in, managerial support, and stakeholder engagement—that appear to drive effective implementation.
View and download this publication.
 Juvenile Arrests, 2016 (Bulletin, National Report Series)
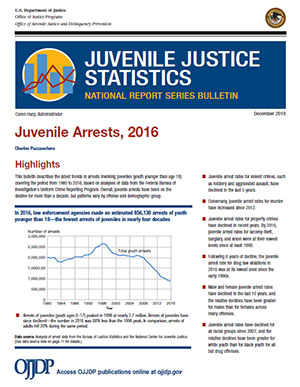
NCJ 251861
This bulletin describes the latest trends in arrests involving juveniles (youth younger than age 18) from 1980 to 2016, based on analyses of data from the Federal Bureau of Investigation’s Uniform Crime Reporting Program. Overall, juvenile arrests have been on the decline for more than a decade; however, patterns vary by offense and demographic group. Juvenile arrest rates for violent crimes, such as robbery and aggravated assault, have declined in the past 5 years. Conversely, juvenile arrest rates for murder have increased since 2012. Property crimes have declined in recent years and by 2016, the juvenile arrest rates for larceny-theft, burglary, and arson were at their lowest levels since at least 1980. Following 6 years of decline, the juvenile arrest rate for drug law violations in 2016 was at its lowest level since the early 1990s.
View and download this publication.
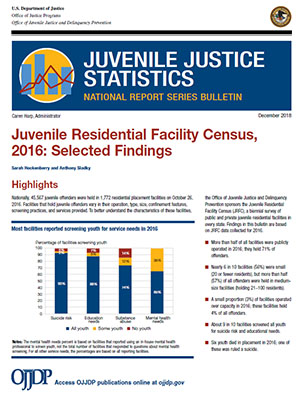 Juvenile Residential Facility Census, 2016: Selected Findings (Bulletin, National Report Series)
NCJ 251785
On October 26, 2016, OJJDP conducted the ninth Juvenile Residential Facility Census, a snapshot of the facilities—both publicly and privately operated—that house youth charged with or adjudicated for law violations. OJJDP’s biennial census collects data on how juvenile facilities operate and the services they provide. Data from the 2016 census indicate that the number of youth in residential placement continues to decline, a trend that has lasted nearly two decades. In 2016, more youth were held in county, city, or municipally operated facilities on the census date than were held in state-operated facilities. Facility crowding affected a relatively small proportion of youth in custody. Most responding facilities routinely evaluated all youth for suicide risk, education needs, substance abuse, and mental health needs.
View and download this publication.
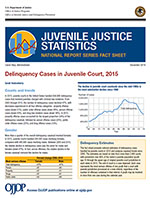
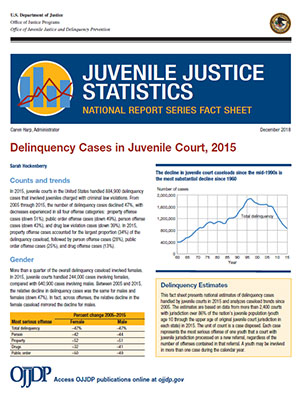 Delinquency Cases in Juvenile Court, 2015 (Fact Sheet, National Report Series)
NCJ 252046
This fact sheet presents national estimates of delinquency cases handled by juvenile courts in 2015 and analyzes caseload trends since 2005. In 2015, juvenile courts in the United States handled 884,900 delinquency cases that involved juveniles charged with criminal law violations. From 2005 through 2015, the number of delinquency cases declined 47 percent, with decreases experienced in all four offense categories: property offense cases (down 51 percent), public order offense cases (down 49 percent), person offense cases (down 43 percent), and drug law violation cases (down 39 percent). In 2015, property offense cases accounted for the largest proportion (34 percent) of the delinquency caseload, followed by person offense cases (28 percent), public order offense cases (25 percent), and drug offense cases (13 percent).
View and download this publication.