|
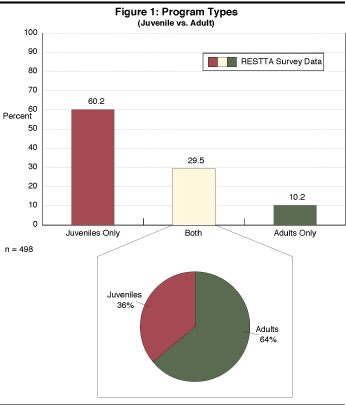
Using the National Directory A total of 547 restitution programs2 responded to the 1991 survey; another 213 responses were received from individuals with no programs. By comparison, 368 programs were identified by the 1986 RESTTA survey. However, in 1986, no questionnaires were accepted from programs that dealt solely with adult offenders. In 1991 this restriction was lifted, and responses from 50 adult programs are included in the total. Table 1 lists the number of programs, by State, that replied to the 1991 survey; Figure 1 displays the percentage of programs that deal with juvenile offenders only, both juveniles and adults, and adults only.  In this edition of the National Directory, programs are listed alphabetically within States, which also are listed alphabetically. Each entry in the Directory contains the program name (if any), its address and telephone number, the jurisdiction in which it is located, and the name of a contact person for the program. In addition, the entry lists the restitution services available (e.g., restitution, community service, and direct victim service), the type of clients accepted into the program, and the name of the court or agency in which it resides. Also included are a description of the program, recent statistics on the number of clients, amounts of restitution paid or number of community service hours worked, successful completion rates, and (when available) recidivism data. For many programs, data are also presented on the seriousness of the offenses of their clients, rated on a scale of one to five. A key to the scale may be found just in front of the Alabama section. In appendix A at the end of the Directory is information on a number of typical cases that reflect the types of offenses that result in referral to these programs and the dispositions or sentences given to the offenders. These descriptions provide some insight into the detail of how restitution and community service programs work. Appendix B contains a listing of all the victim-offender reconciliation and mediation programs that responded to the survey.
|