|
Intake Decision
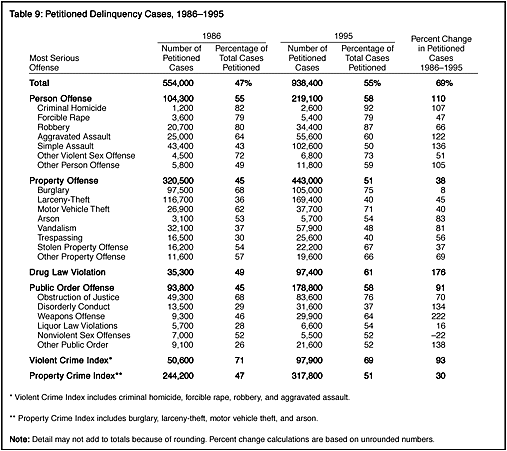
Intake decisions varied among each of the four major offense categories. A detailed analysis of referral offenses showed that the likelihood of formal handling was greater for more serious offenses within the same general offense category. In 1995, for example, 60% of aggravated assault cases were handled formally compared with 50% of simple assault cases. Similarly, more than 70% of burglary and motor vehicle theft cases were handled formally by juvenile courts, compared with 40% of larceny-theft cases and 48% of cases in which vandalism was the most serious charge (table 9).  The likelihood o formal processing for delinquency referrals increased between 1986 and 1995, rising from 47% to 55%. The change in the proportion of cases formally processed varied across offenses. For example, the proportion of cases handled formally rose from 49% to 61% for drug law violation cases and from 28% to 54% for delinquency liquor law violations, while among aggravated assault cases the proportion dropped from 64% to 60%. Among forcible rape, other violent and nonviolent sex offenses, and arson, the proportion of cases formally processed remained essentially the same in 1995 as in 1986. As a result of the increase in the number of cases referred to juvenile court intake and the greater likelihood of petitioning, the number of formally processed delinquency cases increased 69% between 1986 and 1995, from 554,000 cases to 938,400. The single largest increase was for weapons law violation cases, with juvenile courts formally processing 222% more weapons cases in 1995 than in 1986. Other large increases were seen in formally handled drug law violation cases (176%), simple assault cases (136%), aggravated assault cases (122%), and cases involving criminal homicide (107%).
|
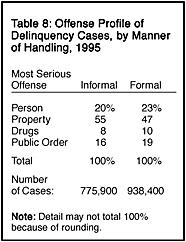
 Among person offense, drug law violation, and public order cases, approximately 6 in 10 cases were handled formally by juvenile courts in 1995 (