|
Detention
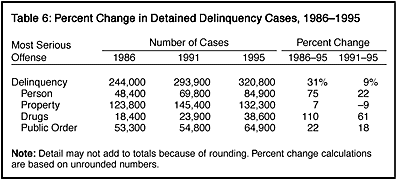
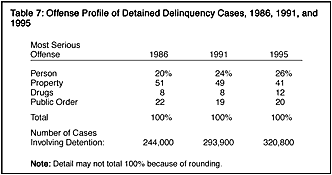
The probability of detention for delinquency cases changed very little between 1986 and 1995. The use of detention ranged between 19% and 23%. The peak year was in 1990. The same pattern was seen in each of the four major offense categories. With the exception of drug law violation cases, use of detention fluctuated within a 5 to 7 percentage point range, with 1990 being the peak year. The use of detention for drug law violation cases also peaked in 1990, but showed a wider variation. In 1990, juveniles were detained in 38% of drug cases and by 1995 that proportion had dropped to 21%; a 17-point change. The number of delinquency cases in which juveniles were detained increased 31% between 1986 and 1995, rising from 244,000 to 320,800 (table 6). Increases occurred in all offense categories, with drug offense cases showing the greatest increase. Between 1986 and 1995, the number of drug offense cases in which youth were detained increased 110%. There was a 75% increase among person offense cases, 22% among public order offense cases, and 7% among property offense cases. During the more recent 5-year period from 1991 to 1995, however, there was a 9% decline in the number of property cases in which juveniles were detained.  Although detention was least likely in property offense cases in 1995, they accounted for 41% of all delinquency cases involving detention because they represented the largest share of juvenile court caseloads (table 7). Person offense cases accounted for 26% of cases involving detention, public order offense cases accounted for 20%, and drug law violation cases accounted for 12%. Between 1986 and 1995, the offense characteristics of delinquency cases involving detention changed somewhat, with person offenses and drug law violations accounting for larger proportions of detentions, and property offenses representing a smaller share in 1995 than in 1986 (41% compared with 51%). 
|
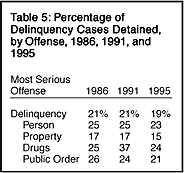
 Juveniles were held in detention facilities at some point between referral to court intake and case disposition in 19% of all delinquency cases disposed in 1995 (table 5). Cases involving property offenses were least likely to involve detention in 1995, while those involving drug offenses were most likely to involve detention. In 1995, 15% of property offense cases involved deention (compared with 24% of drug cases, 23% of person offense cases, and 21% of public order offense cases).