|
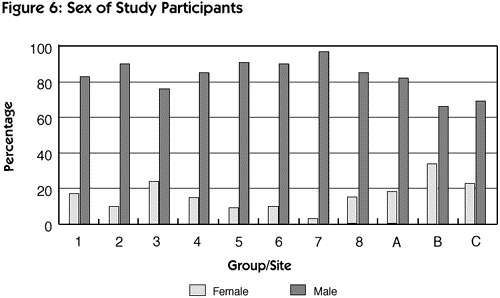
Outcomes Both the ACA/IBH and the APPA projects conducted numerous evaluation activities. Those reported here are limited to the technical assistance sites in which the drug-testing protocols were implemented. The quantitative findings are reported first, followed by the qualitative results of the evaluation.1 Quantitative findings A summary of the major findings from the program evaluation for each project provides an overview of the potential of drug identification programs. The quantitative findings have been divided into two sections: demographic characteristics of the study participants and results of the drug-testing activities. Data on each group of youth followed in the APPA sites are designated with numerals. Groups of youth in the ACA/IBH sites are identified with letters. Three APPA sites participating in the first and second phases of the project were each given two group numbers. Demographics of youth in the sites Sex. The percentage of male youth involved in the APPA study ranged from 76 percent in group 3 to 97 percent in group 7. The average percentage of males in the eight study populations was 87 percent. The ACA/IBH project detention sites had somewhat higher percentages of female youth. The male population ranged from 66 percent in site B to 82 percent in site A. The average percentage of males in the three detention sites was 72 percent. These data, depicted in figure 6, suggest that across these sites, the percentage of female youth being drug tested in detention centers was likely to be higher than the percentage being tested in the APPA project sites, which were predominantly probation. In general, however, at least two-thirds or more of the youth being tested were males. There were some differences in the selection of youth to be tested in these sites. The youth participating in the program in each of the APPA sites did not necessarily represent all youth on probation, but in the ACA/IBH sites, the population reported were all youth entering detention. It is unclear whether the larger male populations in the APPA project sites (compared with the ACA/IBH sites) are a result of more male youth being placed on probation or more male youth being selected (perhaps because of drug-related crimes or substance abuse histories) to participate in these programs.
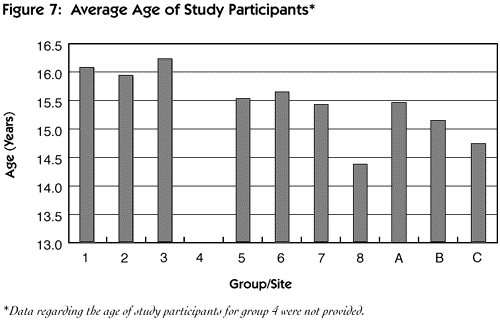
 Age. The ages of youth included in both projects ranged from 8 to 21 years. The average ages of youth across all 11 groups in the two projects ranged from 14.37 years in group 8 to 16.22 years in group 3 (figure 7). There appear to be no significant differences between the average ages of the youth in the detention center sites and those in the APPA sites (predominantly probation).
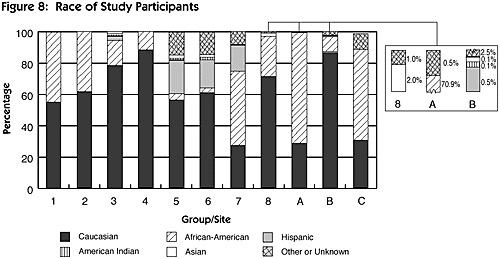
 Based on these data, most of the youth being tested in these sites were about 15 years old. It is important to consider the developmental stage of youth involved in the program. Race and ethnicity. The racial diversity of the youth varied by location. As evident in figure 8, the percentage of Caucasian youth ranged from 28 percent in group 7 to 89 percent in group 4. The proportion of African-American youth ranged from 3 percent in group 6 to 71 percent in site A. Three groups had a substantial percentage of Hispanic youth: 22 percent in group 5, 18 percent in group 6, and 17 percent in group 7. The remaining youth in some sites included small percentages of Native-American and Asian youth. For some sites, the race and ethnicity of a few youth were reported as unknown or the data were missing.
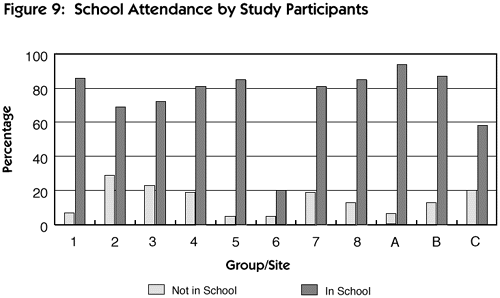
 The racial and ethnic composition of the youth in a drug-testing program are likely to vary based on factors such as the diversity of communities and the youth entering detention and/or probation programs. As with other juvenile justice program issues, it is important to ensure that programs are culturally sensitive and nondiscriminatory. Education of youth. In all but one site, the majority of youth were attending school. However, as depicted in figure 9, the percentages of those in school (excluding group 6) ranged from 58 percent in site C to 94 percent in site A.
 In both projects, the last grade completed by each youth was ascertained. Average grade levels completed ranged from 7.73 in group 4 to 9.64 in group 3 (figure 10).
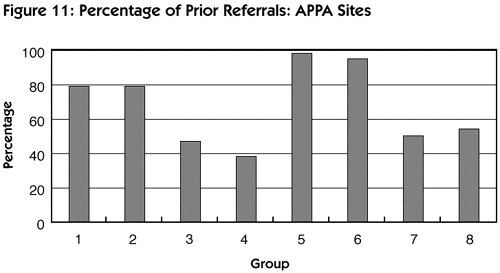
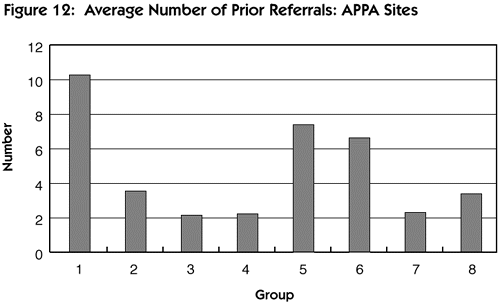
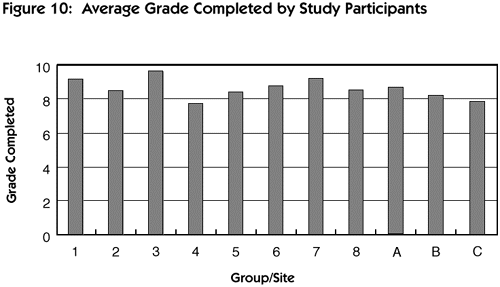 Although the majority of youth in most sites were attending school, significant portions of the program populations in several sites were not in school. Coupled with the lower grade level attainment of the youth in several sites, this information has implications for programming related to drug testing and substance abuse by youth. It is important that explanations about the program and information presented to youth be developmentally appropriate for them. Delinquency history. In all but one APPA site, half or more of the youth included in the drug-testing programs had had some previous delinquency charges before entering the drug identification and intervention program. As shown in figure 11, the percentage of youth known to have any prior delinquency referrals ranged from 38 percent in group 4 to 98 percent in group 5. For youth with any previous charges, the number of prior incidents ranged from 2.14 in group 3 to 10.26 in group 1 (figure 12).
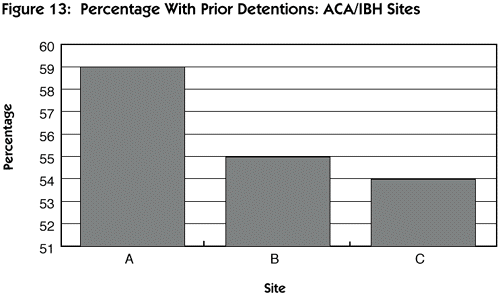
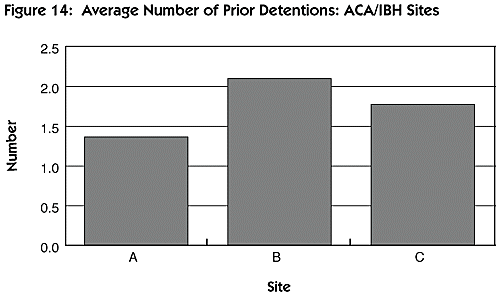
 In the ACA/IBH project sites, shown in figure 13, prior detention experiences could be documented for a very consistent proportion of the population, ranging from 54 percent in site C to 59 percent in site A. The average number of prior detentions in each site, shown in figure 14, was 1.36 in site A, 1.77 in site C, and 2.09 in site B.
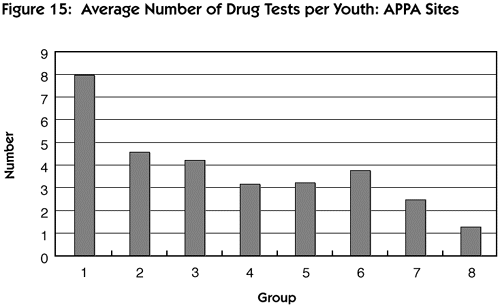
 Although the data on the total number of prior referrals collected by the APPA project sites and the total number of prior detentions collected by the ACA/IBH project sites do not measure precisely the same phenomena, they indicate that in all but one site, half or more of the youth included in the drug-testing program had prior encounters with the juvenile justice system. This underscores the importance of trying to detect alcohol and other drug use at the earliest possible encounter with the juvenile justice system to interrupt the cycle of substance abuse and delinquency as soon as possible. In general, the results of the drug-testing programs in each project showed a significant amount of substance abuse among youth in detention and on probation. Frequency of testing. Almost all youth entering the detention centers underwent testing once. However, in the APPA project sites, urinalysis was performed repeatedly on youth to monitor and deter further substance abuse while they were supervised in the community. The average number of tests administered to each youth during the period of data collection varied from 1.26 to 7.93 in the APPA sites shown in figure 15. The project recommended random testing at least twice per month. However, the frequency of testing was ultimately the responsibility of the programs, and many factors affected the patterns of testing that evolved. It is possible that those sites that performed testing less frequently may have missed some positive results that might have been found with more frequent testing. If so, their positive rates might have been even higher than those shown in figure 16. However, when the frequency of testing was compared with positive urinalysis results, it is interesting that a higher frequency of testing was associated with lower rates of positive results, whereas a lower frequency of testing was associated with higher positive rates. One possible explanation for this may be that when youth are tested with sufficient frequency and positive results bring consistent consequences, the process tends to deter further substance abuse. A higher frequency of testing might also be correlated with increased supervision of and attention to youth, influencing their decisions about whether to engage in illicit drug use. Further research and analysis is necessary to ascertain the strength and sequencing of these factors.
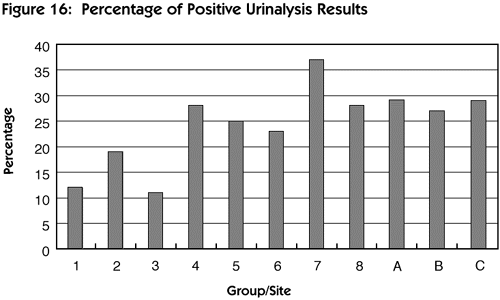
 Percentage of positive urinalysis results. Relatively high rates of drug use were found, as shown in figure 16, ranging from 11 percent in group 3 to 37 percent in group 7. In the ACA/IBH project sites, a consistent rate of positive test results was noted, ranging from 27 percent in site B to 29 percent in sites A and C.
 Positive test results. Each site in the two projects determined the drugs to be tested based on drug use patterns in each community and, sometimes, on cost issues. Table 3 shows the percentage of positive results of urinalysis by site for each type of drug.
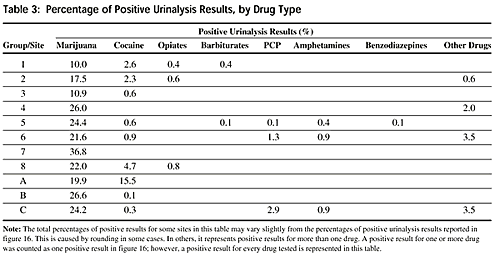 All sites tested for marijuana, and the positive results ranged from 10 percent to 36.8 percent of all tests. Cocaine also was tested for frequently. Only two groups reported no positive results for cocaine. In most sites, the positive rate was relatively low, ranging from 0.1 percent to 4.7 percent. However, one site (site A) had a very high percentage (15.5 percent) of positive results for cocaine. A moderate rate of positive results for marijuana (19.9 percent) was also found in this site. These data provide an illustration of the number of drug-involved youth in a variety of settings throughout the United States. None of the sites represented extremely large cities where drug use may have been more prevalent. Therefore, the positive results depicted above may be an underestimation of the extent of drug use in some areas. Identification of substance-abusing youth is only the first step in the process. To intervene effectively, juvenile justice practitioners must follow both positive and negative results with appropriate actions -- consequences and treatment for positive results or rewards and praise for negative results. However, without the initial identification, no consistent response can occur. Because of the strong association between alcohol and other drug use and delinquency, attempting to correct delinquent behaviors without addressing substance abuse will be very difficult in most cases.
1 The information for this section comes from the final project reports submitted by ACA/IBH and APPA to OJJDP (American Correctional Association/Institute for Behavior and Health, Inc., 1995; American Probation and Parole Association, 1994).
|