|
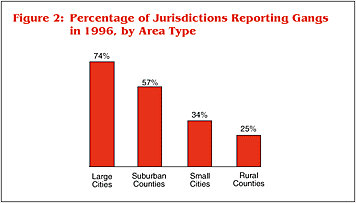
Approximately 53 percent of all survey respondents in the representative sample reported that youth gangs were active in their jurisdictions in 1996. More specifically, figure 2 shows that 74 percent of large cities reported gangs in 1996, followed by 57 percent of suburban counties, 34 percent of small cities, and 25 percent of rural counties (see Appendix F for a list of all jurisdictions reporting gangs in 1996, by area type). The relationship between agencies reporting gangs in 1996 and area type was found to be statistically significant.
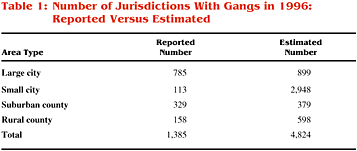
To estimate the number of cities and counties nationwide that had gangs in 1996, extrapolations were conducted for both the random samples of small cities and rural counties and the nonrespondents for large cities and suburban counties. Table 1 shows the reported number of jurisdictions with gangs in 1996 and the estimated or extrapolated number. It was estimated that approximately 4,824 jurisdictions throughout the country had active youth gangs in 1996.
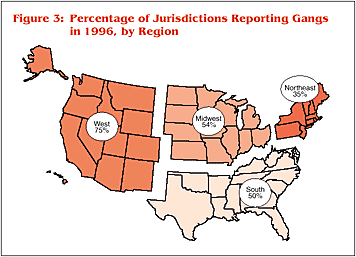
Figure 3 presents the percentages of survey respondents reporting gangs in 1996 for each region of the country. Respondents in the West, which has historically experienced significant gang problems, reported the highest level of gang activity (75 percent). This is more than 20 percent higher than the next highest region, the Midwest, which reported 54 percent. In addition, 50 percent of the survey respondents in the South reported gangs in 1996, followed by 35 percent for the Northeast.
Gang activity throughout the United States appeared to vary substantially by region. The differences in gang activity by region were found to be statistically significant. Both population size and area type had a statistically significant relationship to the level of gang activity reported for each region (see Appendixes G and H).
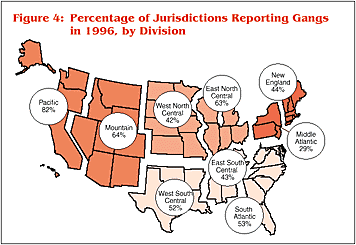
For the purposes of this survey, each geographic region was divided into smaller increments called divisions (see Appendix E). Figure 4 illustrates the percentage of jurisdictions reporting gangs, by division. As figure 4 illustrates, the Pacific division within the western region experienced significantly more gang problems than all other divisions throughout the country, with 82 percent of jurisdictions reporting gangs. In light of these findings, each State in the Pacific division was analyzed separately, excluding Alaska and Hawaii.5 California, Washington, and Oregon all reported particularly high levels of gang activity. California led all States in this division, with 85 percent of survey respondents reporting gangs in 1996, followed by 78 percent for Washington and 64 percent for Oregon.
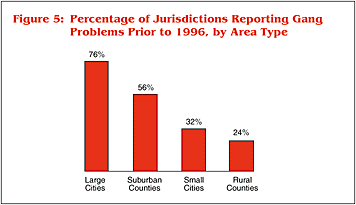
Survey recipients also were asked if they had youth gang problems prior to 1996. As expected, the highest proportion (76 percent) of affirmative answers came from large cities (see figure 5). The percentages for the remaining area types were as follows: suburban counties, 56 percent; small cities, 32 percent; and rural counties, 24 percent.
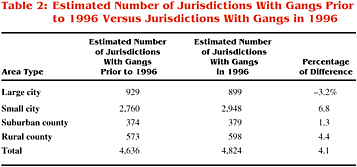
Following extrapolation, the estimated number of jurisdictions reporting gangs prior to 1996 was compared with the estimated number reporting gangs in 1996. There was an overall 4.1-percent increase in the number of jurisdictions reporting youth gangs (see table 2). Small cities had the greatest increase, with 6.8 percent, followed by rural counties with 4.4 percent and suburban counties with 1.3 percent. Large cities showed a 3.2-percent decrease in gang activity. An estimated 30 large cities had gangs prior to 1996 but none in 1996.
Determining why a community may no longer have a gang problem allows other jurisdictions to replicate successful prevention and intervention strategies. Followup interviews will be conducted with a randomly selected group of agencies that reported gangs prior to 1996 but no gangs in 1996. Interviews also will be conducted with agencies that reported gangs in 1996 but no previous gang problem, in order to determine what led to the development of gangs in those jurisdictions. When this analysis is complete, the results will be reported.
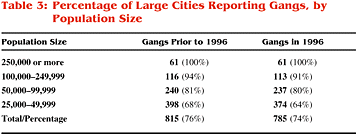
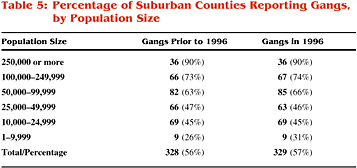
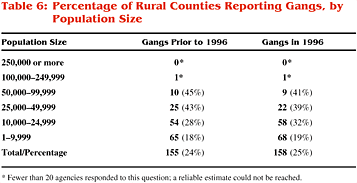
Population size appears to affect the likelihood that jurisdictions will experience gang problems. There was a direct variation between gang activity and population size for agencies reporting gangs in 1996 and for those reporting gangs prior to 1996 (see tables 3-6). Chi-square tests showed these relationships to be statistically significant for all area types.
|
