|
Race 
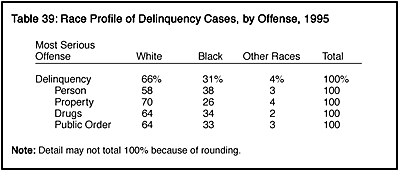
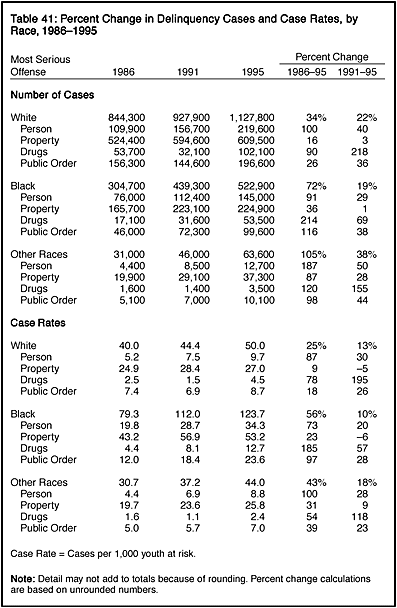
The number of cases involving white youth increased 34% between 1986 and 1995, while cases involving black youth increased 72%, and the number of cases involving youth of other races increased 105% (table 41). Trends differed somewhat across race groups. For all three race groups, property cases showed the lowest percentage increase. For black juveniles, drug cases showed the largest percent change -- an increase of 214%. For white youth and youth of other races, the greatest relative growth was among person cases.  Delinquency case rates differed substantially by race. The total case rate for black juveniles in 1995 (123.7 cases disposed for every 1,000 youth at risk) was more than twice the rate for white juveniles (50.0) or youth of other races (44.0). The person offense and drug law violation case rates among black youth were at least three times greater than the corresponding rates for white youth and youth of other races. In all offense categories, the case rate for juveniles of other races was lower than the corresponding rate for either black or white juveniles. Overall, the delinquency case rates increased with age from ages 10 to 16, and then declined slightly at age 17. Among blacks, however, the rate for 17-year-olds was higher than the rate for 16-year-olds (figure 11). Age-related increases in delinquency case rates occurred within each of the four offense categories for each racial group, although there were variations across the 12 offense-race combinations (figure 12). For example, among white 13-year-olds the person offense case rate increased from 8.4 cases per 1,000 to 18.1 cases per 1,000 for whites age 16. For black juveniles, the person offense case rate grew from 31.8 at age 13 to 60.6 at age 16. 5 In 1995, whites made up approximately 80% of the national population of youth at risk of referral to a juvenile court. Nearly all youth of Hispanic ethnicity are included in the white racial category.
|
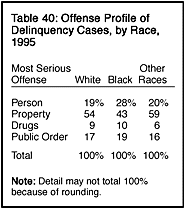
 For all racial groups, a property offense was the most common charge involved in delinquency cases disposed in 1995 (table 40). Property offenses accounted for 54% of all cases involving white youth, 43% of those involving black youth, and 59% of cases involving youth of other races. In 28% of cases involving blacks, the youth was charged with a person offense (compared with 19% of cases involving white youth and 20% of cases involving youth of other races). Cases involving black or white youth included a slightly larger proportion of drug law violations (10% and 9%, respectively) than cases involving youth of other races (6%).