|
Delinquency Cases
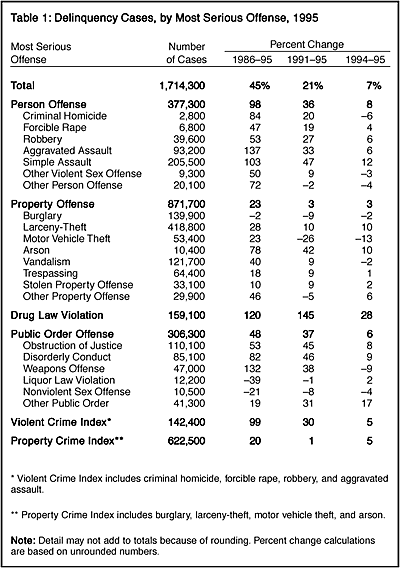
Counts and Trends The number of person offense cases increased 98% between 1986 and 1995, property offense cases increased 23%, drug law violation cases increased 120%, and public order offense cases grew 48%. Compared with 1986, juvenile courts in 1995 handled 84% more criminal homicide cases, 47% more rape cases, 53% more robbery cases, 137% more aggravated assault cases, and 103% more simple assault cases. During the same time period, juvenile courts saw their weapons offense caseloads climb 132% and cases involving motor vehicle theft increase 23%. Several offense categories had drops in caseloads between 1994 and 1995; criminal homicide cases dropped 6%, weapons offense cases dropped 9%, and motor vehicle theft cases dropped 13%. Examination of the caseloads of juvenile courts using the Federal Bureau of Investigation (FBI) crime indexes indicates that juvenile courts handled substantially more Violent Crime Index offense cases in 1995 than in 1986 (99%), while cases involving Property Crime Index offenses increased 20%.1 The increases in juvenile court cases parallel the increases in arrests of persons under the age of 18, as reported by the FBI. Between 1986 and 1995, the number of arrests involving persons under the age of 18 charged with Violent Crime Index offenses increased 67%, while arrests of youth for Property Crime Index offenses increased 8%. (See Crime in the United States 1995.) According to the FBI, the number of juvenile arrests for homicide increased 90% between 1986 and 1995 but decreased 14% between 1994 and 1995, changes that closely correspond to the trends in juvenile court cases involving homicide charges.
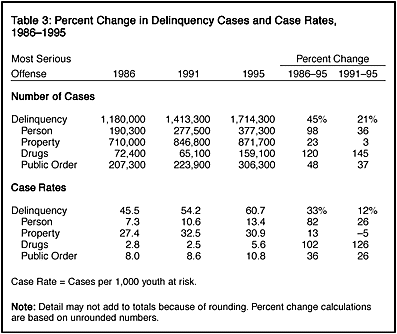
In 1995, juvenile courts processed 60.7 delinquency cases for every 1,000 juveniles who resided in the United States and were at risk of referral -- those age 10 or older who were under the jurisdiction of a juvenile court (table 3).2 Analysis of this case rate permits comparisons of juvenile court activity over time while controlling for differences in the population at risk of referral to the juvenile court. The total delinquency case rate rose 33% from 1986 to 1995.3 During the same time period, case rates increased in all offense categories. The case rate for person offenses climbed 82%, the property case rate increased 13%, the rate of drug cases grew 102%, and the rate of public order offense cases increased 36%. Over the more recent 5-year period, however, the property case rate declined 5%.  1 The annual series of reports from the FBI, Crime in the United States, provides information on arrests in offense categories that have become part of the common vocabulary of criminal justice statistics. The Crime in the United States series tracks changes in the general nature of arrests through the use of two indexes, the Violent Crime Index and the Property Crime Index. While not containing all violent or all property offenses, the indexes serve as a barometer of criminal activity in the United States. 2 The upper age of juvenile court jurisdiction is defined by statute in each State. See the Glossary of Terms section for a more detailed discussion on upper age of juvenile court jurisdiction. The case rates presented in this report control for State variations in youth population at risk of referral to juvenile court. 3 The percent change in the number of cases disposed may not be equal to the percent change in case rates due to the changing size of the juvenile population.
|

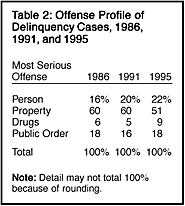
 The offense profile of juvenile court caseloads changed somewhat between 1986 and 1995 (table 2). The relative proportion of person offenses increased, while property offenses declined. A person offense, such as robery or assault, was the most serious charge in 22% of delinquency cases in 1995 compared with 16% in 1986. A property offense, such as shoplifting, burglary, or vandalism, was the most serious charge in 51% of the delinquency cases handled by juvenile courts in 1995 versus 60% in 1986. The proportion of drug law violations, such as possession or sale of controlled substances, rose from 6% in 1986 to 9% in 1995. Public order offenses remained relatively unchanged between 1986 and 1995.