|
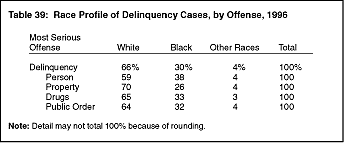
White youth accounted for 66% of the delinquency cases disposed by juvenile courts in 1996 (table 39).7 White youth accounted for 59% of person offense cases, 70% of property offense cases, 65% of drug law violation cases, and 64% of public order cases. Black youth accounted for 30% of all delinquency cases, 38% of person offense cases, 26% of property cases, 33% of drug cases, and 32% of public order cases. Juveniles of other races accounted for 4% of all delinquency cases in 1996 and comparable proportions of each of the four major offense categories.
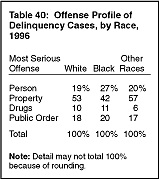
For all racial groups, a property offense was the most common charge involved in delinquency cases disposed in 1996 (table 40). Property offenses accounted for 53% of all cases involving white youth, 42% of those involving black youth, and 57% of cases involving youth of other races. In 27% of cases involving blacks, the youth was charged with a person offense, compared with 19% of cases involving white youth and 20% of cases involving youth of other races. The proportion of cases involving drug law violations was somewhat larger for black youth (11%) and white youth (10%) than for youth of other races (6%).
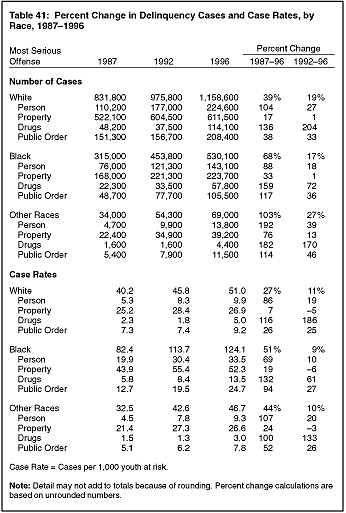
The number of cases involving white youth increased 39% between 1987 and 1996, while cases involving black youth increased 68%, and cases involving youth of other races increased 103% (table 41). Trends differed somewhat across racial groups. For all three groups, the smallest percent increase was in property cases. For black juveniles and white juveniles, drug cases showed the largest percent increase: 159% and 136%, respectively. For youth of other races, the greatest relative growth was in person cases (192%).
Delinquency case rates differed substantially by race. The total case rate for black juveniles in 1996 (124.1) was more than twice the rates for white juveniles (51.0) and for youth of other races (46.7). The person offense case rate for black youth was more than three times greater than the corresponding rates for white youth and for youth of other races. The drug law violation case rate for black juveniles (13.5) was more than twice the rate for white juveniles (5.0) and more than four times the rate for youth of other races (3.0). In all offense categories, the case rates for black juveniles and for white juveniles were higher than the corresponding rate for other races.
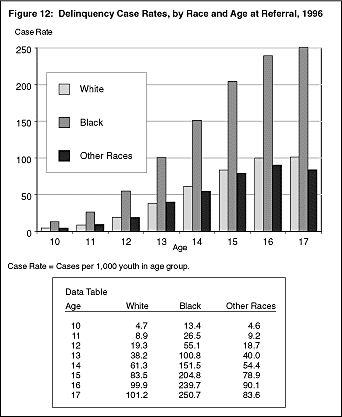
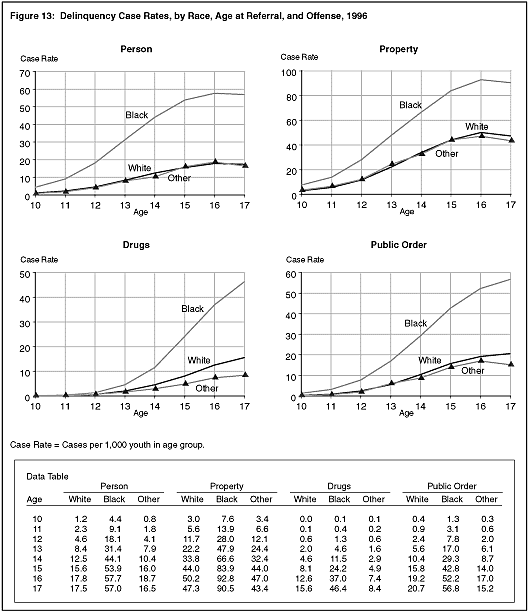
Overall, delinquency case rates increased with age in all racial groups. Among youth of other races, however, the rate at age 17 was slightly lower than the rate for 16-year-olds (figure 12). Age-related increases in delinquency case rates occurred within each of the four offense categories for each racial group, although there were variations across the 12 offense-race combinations (figure 13). For example, among white youth, the person offense case rate increased from 8.4 cases per 1,000 13-year-olds to 17.8 cases per 1,000 16-year-olds. For black juveniles, the person offense case rate grew from 31.4 at age 13 to 57.7 at age 16.
Detention
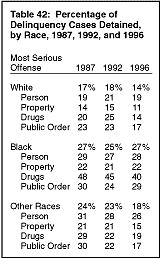
In 1996, youth were detained at some point between referral and disposition in 27% of delinquency cases involving black juveniles, 14% of cases involving whites, and 18% of cases involving youth of other races (table 42). The largest racial variation in detention use was for cases involving drug law violations. Detention was used in 14% of drug cases involving white juveniles, 40% of cases involving blacks, and 19% of cases involving youth of other races.
Between 1987 and 1996, the proportion of cases involving detention stayed about the same for black juveniles (around 27%); for whites and youth of other races, the proportion declined slightly, with much of the change occurring between 1990 and 1996. For all racial groups, the greatest decline in use of detention was for drug cases (8 to 11 percentage points). Use of detention for public order cases increased for black juveniles but decreased for whites and youth of other races.
Intake Decision
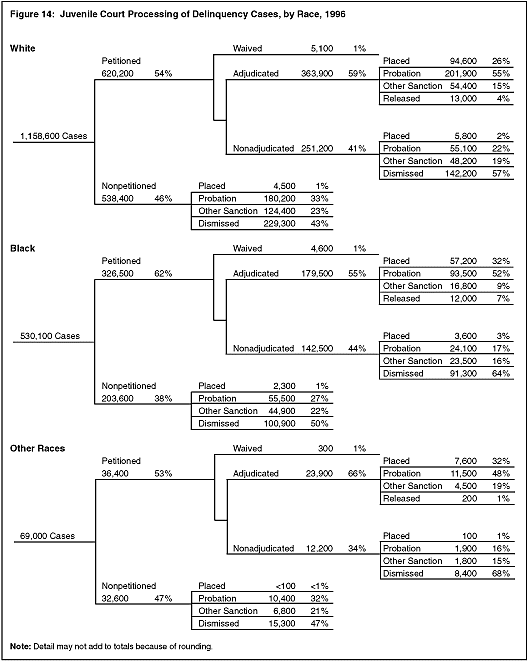
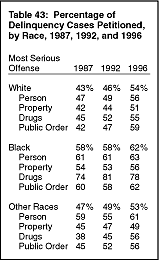
In 1996, delinquency cases involving black juveniles were more likely to be handled formally than were cases involving white youth or youth of other races. Formal handling was used in 62% of cases involving black juveniles, 54% of cases involving white juveniles, and 53% of cases involving juveniles of other races (figure 14). Racial differences in the likelihood of formal handling were greatest for drug law violation cases: 78% of drug cases involving black juveniles were handled by formal petition, compared with 55% for white juveniles and 56% for juveniles of other races (table 43). Between 1987 and 1996, the likelihood of formal petitioning generally increased across all four offense categories for all racial groups.
Judicial Decision and Disposition
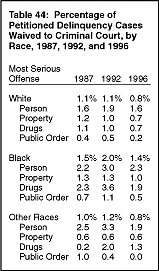
Overall, delinquency cases involving black juveniles were somewhat more likely to be judicially waived to criminal court than were cases involving whites and youth of other races. In 1996, 1.4% of formally processed cases involving black juveniles were waived, compared with 0.8% of cases involving whites and youth of other races (table 44).
Among both whites and blacks, the use of waiver to criminal court for cases involving drug offenses increased between 1987 and 1991, then declined through 1996. The use of waiver in person offense cases involving white youth increased from 1987 through 1994, then dropped, so that such cases were as likely to be waived in 1996 as in 1987. The trend in the use of waiver for person offense cases involving black youth was similar to the trend for white youth, although the proportions of cases waived each year were higher.
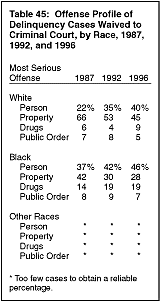
Compared with 1987, property offense cases in 1996 made up a smaller proportion of all waived cases involving either white or black juveniles (table 45). On the other hand, person offense cases accounted for a growing proportion of waived cases between 1987 and 1996, increasing from 22% to 40% for white youth and from 37% to 46% for black youth. Among black youth, the proportion of waived cases that involved drug offenses rose substantially from 1987 to 1991 (from 14% to 28%), declined to 16% in 1993, and then increased to the 1996 level (19%). This shifting in drug cases as a proportion of waived cases was not seen among white youth.
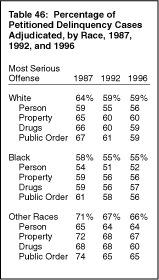
Petitioned cases involving black juveniles were less likely to be adjudicated (55%) than were cases involving white juveniles (59%) or juveniles of other races (66%) in 1996 (table 46). The lower rate of adjudication for blacks was found in all four major offense categories.
The likelihood of adjudication for petitioned delinquency cases declined between 1987 and 1996 for all racial groups. In drug cases, for example, the likelihood of adjudication decreased for cases involving white youth (from 66% to 59%), black youth (from 59% to 57%), and youth of other races (from 68% to 60%).
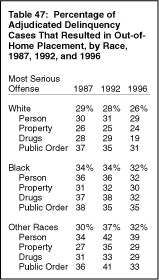
Adjudicated cases involving white youth were less likely to result in out-of-home placement in 1996 (26%) than were cases involving black youth (32%) or youth of other races (32%) (table 47). From 1987 through 1996, the use of residential placement for cases involving white youth declined. During the same period, the use of residential placement increased somewhat and then declined for cases involving black youth or youth of other races. Changes in the likelihood of out-of-home placement varied slightly across the four major offense categories within racial groups. For white youth and black youth, the most substantial variation was in the use of residential placement for drug cases.
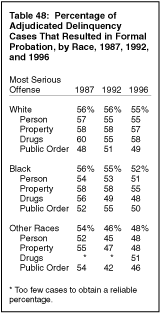
Adjudicated delinquency cases involving white juveniles were generally more likely to result in formal probation than were cases involving either black juveniles or youth of other races (table 48). In 1996, formal probation was the disposition for 55% of adjudicated cases involving white youth, compared with 52% for blacks and 48% for other races. Between 1987 and 1996, use of formal probation remained relatively unchanged for white youth, but declined for blacks and other races.
|
