|
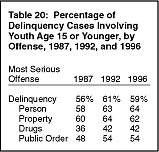
In 1996, 59% of all delinquency cases processed by the Nation's juvenile courts involved youth who were age 15 or younger at the time of referral, compared with 56% in 1987 (table 20). In 1996,
juveniles age 15 or younger were responsible for 64% of person offense cases, 62% of property offense cases, 42% of drug law violation cases, and 54% of public order offense cases.
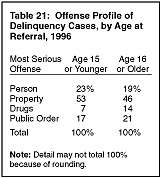
Compared with the delinquency caseload involving older juveniles, the caseload of youth age 15 or younger in 1996 included larger proportions of person and property offense cases and smaller proportions of drug and public order offense cases (table 21). Property offense cases accounted for 53% of the cases involving youth age 15 or younger, compared with 46% of cases involving youth age 16 or older. Drug law violations made up 7% of cases involving younger juveniles, compared with 14% of cases involving older juveniles.
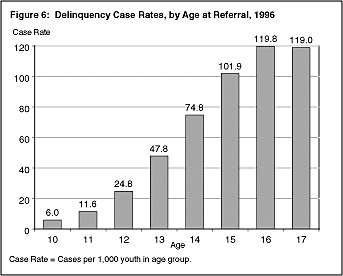
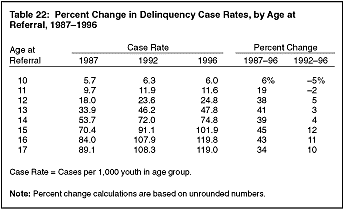
In 1996, delinquency case rates generally increased with the age of the juvenile. For example, the case rate for 16-year-olds was 60% greater than the rate for 14-year-olds, while the rate for 14-year-olds was more than 3 times the rate for 12-year-olds (figure 6). Contrary to this pattern, the case rate for 17-year-olds was slightly less than the rate for 16-year-olds. The Nation’s juvenile courts disposed 119.0 delinquency cases for every 1,000 youth age 17 in the juvenile population in 1996; among 16-year-olds, the courts disposed 119.8 cases for every 1,000 youth age 16 in the juvenile population. For all age groups 12 and older, delinquency case rates increased 34% or more between 1987 and 1996 (table 22). Delinquency case rates reached a 10-year peak in 1996 for each of these age groups. For younger juveniles, however, case rates dropped from 1992 to 1996: 5% for 10-year-olds and 2% for 11-year-olds.
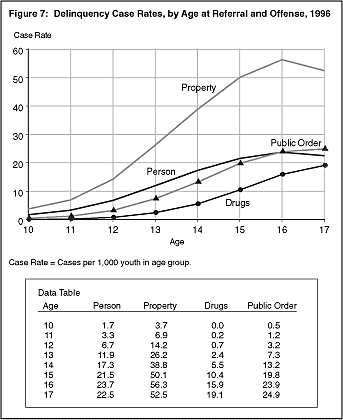
Patterns of age-specific case rates varied among individual offense categories in 1996. Case rates increased continuously with age for drug and public order offenses, while rates for person and property offenses peaked in the 16-year-old age group and then declined slightly for 17-year-olds (figure 7). Drug law violation case rates showed the sharpest increases after age 13. The case rate for drug offenses for 17-year-old juveniles was 696% greater than the corresponding case rate for 13-year-olds. For person offenses, the 17-year-olds’ case rate was 89% greater than the 13-year-olds’ case rate. For property offenses, the difference in case rates between these two ages was 100%, while for public order offenses, the difference was 241%.
Detention
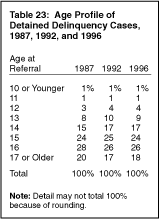
Juveniles younger than 16 accounted for 56% of the cases that involved detention in 1996, while those younger than 14 accounted for 15% (table 23). The age profile for detention cases changed only slightly between 1987 and 1996. The proportion of cases that involved juveniles younger than 16 increased from 52% in 1987 to 56% in 1996.
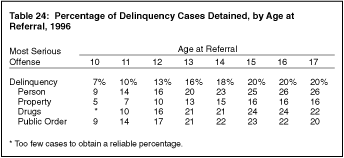
In 1996, detention was used more frequently for older juveniles than for younger juveniles. Detention was used in 13% of delinquency cases involving 12-year-olds, 18% of cases involving 14-year-olds, and 20% of cases involving youth ages 15, 16, or 17 (table 24). In general, the likelihood of detention increased for each successive age group through age 15 across all offense categories. However, for all offense categories, detention was not more likely for cases involving 17-year-olds than for cases involving 16-year-olds.
Intake Decision
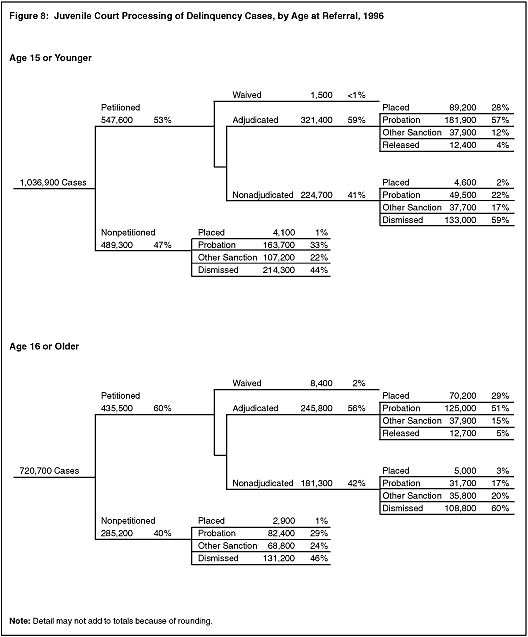
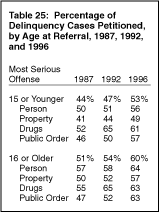
Delinquency cases involving juveniles age 16 or older in 1996 were more likely to be handled formally than were cases involving younger juveniles (figure 8). Overall, 53% of delinquency cases involving youth age 15 or younger were processed with the filing of a petition, compared with 60% of cases involving older youth. The likelihood of formal handling increased between 1987 and 1996 for both younger and older youth in all offense categories (table 25).
Judicial Decision and Disposition
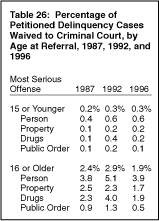
The probability of waiver to criminal court was substantially greater for cases involving older juveniles than for cases involving younger juveniles. In 1996, 1.9% of all formally processed delinquency cases involving juveniles age 16 or older were waived to criminal court, compared with 0.3% of cases involving younger juveniles (table 26). For older juveniles, the probability of waiver increased between 1987 and 1992 and then declined between 1992 and 1996. This pattern was most marked for older juveniles charged with drug offenses, where the proportion of cases waived went from 2.3% to 4.0% and then down to 1.9%. For younger juveniles, the overall use of waiver remained relatively unchanged, although there were some variations among offense categories.
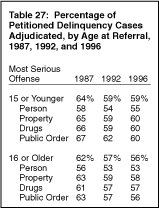
Once petitioned, juveniles age 15 and younger were slightly more likely to be adjudicated delinquent than were older youth (59% versus 56% in 1996). This pattern was found in all four offense categories (table 27). Both age groups reflected the general decline between 1987 and 1996 in the proportion of formally handled cases that resulted in adjudication—from 64% to 59% among younger youth and from 62% to 55% among older youth. For both age groups, the likelihood of adjudication decreased in all offense categories.
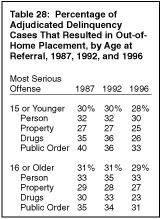
In 1996, the proportion of adjudicated cases placed outside the home was just under 30% for both age groups (table 28). The use of placement for adjudicated delinquency cases involving person and property offenses remained relatively unchanged between 1987 and 1996 for both younger and older youth. There was, however, substantial change between 1987 and 1996 in the use of placement for drug offense cases: for both age groups, the use of placement in adjudicated drug cases increased between 1987 and 1992 and then declined 10 points between 1992 and 1996.
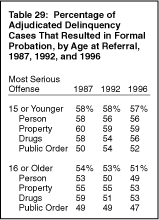
Once adjudicated, younger juveniles had a greater likelihood of being placed on formal probation than did older juveniles. In 1996, 57% of adjudicated cases involving younger youth resulted in probation, compared with 51% for older youth (table 29). With the exception of drug law violation cases, changes in the use of probation between 1987 and 1996 were relatively minor for both age groups. For older youth, the use of probation for drug cases was considerably lower in 1996 than in 1987.
|
