|
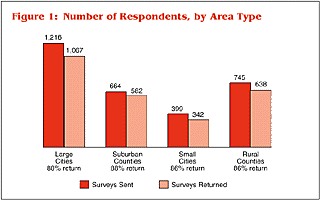
In the first 2 months after the surveys were mailed, the initial response rate was approximately 50 percent. After followup calls were conducted, the response rate increased to approximately 87 percent for the representative sample and 81 percent for the comparative sample. Response rates for the representative sample varied by area type, but not significantly (see figure 1). Large cities and suburban counties had the highest response rate (88 percent), followed by small cities and rural counties (86 percent).
In a few cases, respondents failed to answer one or more questions in the survey. In these cases, the agency was excluded from the analysis of the respective question or questions. Evaluation of the number of agencies that answered different questions revealed that respondents were less likely to answer if they were asked to indicate a percentage or raw number. In contrast, respondents were more likely to answer questions that asked them to select from a list. There did not appear to be any other survey design or methodological problems that contributed to the likelihood that a respondent would or would not answer a question.
|
