Chapter 2
National Estimates of Delinquency Cases
Delinquency offenses are acts committed by juveniles that, if committed by an adult, could result in criminal prosecution. This chapter documents the volume of delinquency cases referred to juvenile court and examines the characteristics of these cases, including types of offenses charged, demographic characteristics of the juveniles involved (age, gender, and race), and sources of referral.
Analysis of case rates permits comparisons of juvenile court activity over time while controlling for differences in the size and demographic characteristics of the juvenile population. Rates are calculated as the number of cases for every 1,000 juveniles in the population—those age 10 or older who were under the jurisdiction of a juvenile court.1
The chapter focuses on cases disposed in 2004 and examines trends since 1985.
Counts and Trends
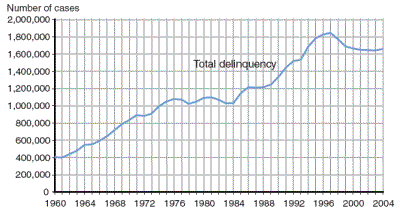
In 2004, courts with juvenile jurisdiction handled an estimated 1,660,700 delinquency cases.
In 1960, approximately 1,100 delinquency cases were processed daily. In 2004, juvenile courts handled about 4,500 delinquency cases per day.
The number of delinquency cases processed by juvenile courts increased 44% between 1985 and 2004.
Between its peak year 1997 and 2004, the delinquency caseload declined 10%.
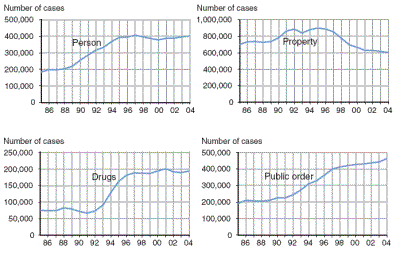
Between 1997 and 2004, the number of public order offense cases increased 16% and drug law violation cases increased 3%, while both person and property offense cases decreased (1% and 29%, respectively).
Public order offense cases accounted for more than half (53%) of the growth in the delinquency caseload between 1985 and 2004. Person offense cases made up another 43% of the increased number of delinquency cases processed during this time period.
Offense profile of delinquency cases
| Most serious offense |
1985 |
2004 |
|
| Person |
16%
|
24%
|
| Property |
61
|
36 |
| Drugs |
7 |
12
|
| Public order |
17
|
28 |
| Total |
100% |
100%
|
Note: Detail may not total 100% because of rounding.
|
Between 1960 and 2004, juvenile court delinquency caseloads increased nearly 300%
Between 1985 and 2004, delinquency caseloads involving person, drug, and public order offenses more than doubled; in contrast, the property offense caseload decreased 14%
In recent years, the number of cases handled by juvenile courts has
decreased for most property offenses and increased for most public
order offenses
Most serious offense |
Number of cases
|
Percent change
|
2003 |
2004 |
1995–
2004 |
2000–
2004 |
2003–
2004 |
|
Total delinquency |
1,643,100 |
1,660,700 |
-7% |
0% |
1% |
Total person |
395,700 |
400,700 |
2% |
6% |
1% |
Criminal homicide |
1,800 |
1,700 |
-42% |
-2% |
-9% |
Forcible rape |
4,500 |
4,200 |
-27% |
-3% |
-7% |
Robbery |
21,400 |
21,100 |
-50% |
-1% |
-1% |
Aggravated assault |
44,000 |
44,600 |
-39% |
-8% |
1% |
Simple assault |
279,600 |
284,300 |
23% |
10% |
2% |
Other violent sex offenses |
16,100 |
15,800 |
34% |
22% |
-2% |
Other person offenses |
28,300 |
29,000 |
12% |
1% |
3% |
Total property |
615,800 |
603,200 |
-33% |
-10% |
-2% |
Burglary |
101,000 |
95,500 |
-35% |
-11% |
-5% |
Larceny-theft |
280,700 |
278,300 |
-34% |
-10% |
-1% |
Motor vehicle theft |
37,100 |
33,900 |
-37% |
-7% |
-9% |
Arson |
8,400 |
8,500 |
-26% |
-8% |
1% |
Vandalism |
96,200 |
96,300 |
-23% |
-5% |
0% |
Trespassing |
50,200 |
50,700 |
-25% |
-5% |
1% |
Stolen property offenses |
20,300 |
19,400 |
-48% |
-23% |
-5% |
Other property offenses |
21,800 |
20,700 |
-40% |
-20% |
-5% |
Drug law violations |
189,000 |
193,700 |
19% |
0% |
2% |
Public order offenses |
442,500 |
463,100 |
41% |
9% |
5% |
Obstruction of justice |
209,400 |
216,500 |
70% |
5% |
3% |
Disorderly conduct |
111,800 |
121,600 |
35% |
27% |
9% |
Weapons offenses |
37,800 |
41,000 |
-12% |
8% |
9% |
Liquor law violations |
28,300 |
29,000 |
78% |
4% |
3% |
Nonviolent sex offenses |
13,800 |
13,800 |
48% |
4% |
0% |
Other public order offenses |
41,500 |
41,000 |
5% |
-11% |
-1% |
Violent Crime Index* |
71,800 |
71,600 |
-42% |
-6% |
0% |
Property Crime Index** |
427,200 |
416,100 |
-35% |
-10% |
-3% |
* Includes criminal homicide, forcible rape, robbery, and aggravated assault.
** Includes burglary, larceny-theft, motor vehicle theft, and arson.
Note: Detail may not add to totals because of rounding.
Percent change calculations are based on unrounded numbers. |
Compared with 1995, juvenile courts handled 78% more liquor law violation cases in 2004, 70% more obstruction of justice cases, 48% more nonviolent sex offense cases, 35% more disorderly conduct cases, and 23% more simple assault cases.
Between 2000 and 2004, caseloads dropped in several offense categories, including stolen property offenses (23%), burglary (11%), larceny- theft (10%), aggravated assault (8%), arson (8%), and motor vehicle theft (7%).
Trends in juvenile court cases paralleled trends in arrests of persons younger than 18. The number of juvenile court cases involving offenses included in the FBI's Violent Crime Index2 (criminal homicide, forcible rape, robbery, and aggravated assault) declined 6% between 2000 and 2004. The FBI reported that the number of arrests involving persons younger than age 18 charged with Violent Crime Index offenses decreased 5% during this same period.
Between 2000 and 2004, the volume of juvenile court cases involving Property Crime Index offenses (burglary, larceny-theft, motor vehicle theft, and arson) declined 10%, and the FBI reported arrests of persons under age 18 for Property Crime Index offenses decreased 15%.
Case Rates
More than 31 million youth were under juvenile court jurisdiction in 2004. Of these youth, 80% were between the ages of 10 and 15, 12% were age 16, and 8% were age 17. The small proportion of 16- and 17- year-olds among the juvenile court population is related to the upper age of juvenile court jurisdiction, which varies by State. In 2004, youth age 16 in 3 States were under the original jurisdiction of the criminal court, as were youth age 17 in an additional 10 States.
-
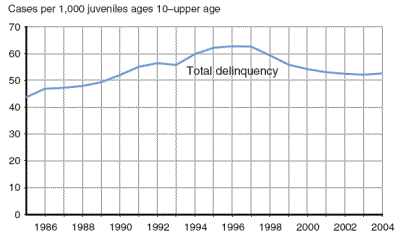
In 2004, juvenile courts processed 52.6 delinquency cases for every 1,000 juveniles in the population—those age 10 or older who were under the jurisdiction of a juvenile court.
The total delinquency case rate increased 43% between 1985 and 1996 and then declined 16% to the 2004 level.3
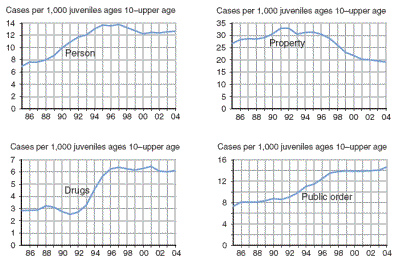
Between 1985 and 2004, case rates more than doubled for drug law violations (116%) and public order offenses (101%); person offense case rates increased 83%.
In contrast to other offense categories, case rates for property offenses declined 28% between 1985 and 2004.
Delinquency case rates rose from 43.7 to 62.7 per 1,000 juveniles between 1985 and 1996 and then steadily declined to 52.6 in 2004
Between 1985 and 2004, case rates for public order offenses doubled (from 7.3 to 14.7 per 1,000 juveniles)
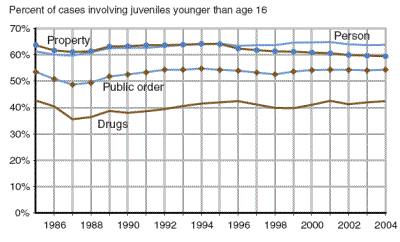
In 2004, juveniles younger than age 16 accounted for more than half of all delinquency cases, including nearly two-thirds of person offense cases
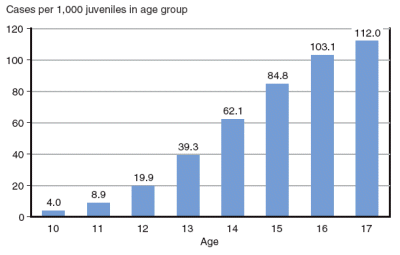
Between 1997 and 2004, delinquency case rates declined for all age groups
|
|
Case rate
|
|
Year
|
Age 10 |
Age 11 |
Age 12 |
Age 13 |
Age 14 |
Age 15 |
Age 16 |
Age 17 |
|
1985 |
6.0 |
10.0 |
18.3 |
33.5 |
50.8 |
66.8 |
79.1 |
79.8 |
1986 |
5.8 |
9.5 |
18.2 |
34.7 |
54.5 |
72.2 |
86.0 |
86.0 |
1987 |
5.8 |
10.0 |
18.6 |
35.3 |
56.4 |
73.5 |
85.1 |
86.4 |
1988 |
6.1 |
9.9 |
19.7 |
36.3 |
58.7 |
75.8 |
87.5 |
88.4 |
1989 |
6.1 |
10.9 |
20.7 |
39.8 |
60.9 |
80.7 |
92.5 |
89.2 |
1990 |
6.2 |
11.2 |
22.1 |
41.9 |
66.7 |
85.3 |
100.1 |
97.8 |
1991 |
6.6 |
11.9 |
23.6 |
45.9 |
70.0 |
92.2 |
103.7 |
104.8 |
1992 |
6.3 |
12.0 |
23.7 |
46.5 |
74.0 |
92.6 |
108.1 |
107.1 |
1993 |
5.7 |
10.7 |
22.7 |
45.1 |
72.4 |
94.7 |
106.5 |
108.4 |
1994 |
6.1 |
11.4 |
23.9 |
48.9 |
76.6 |
99.8 |
116.3 |
112.9 |
1995 |
6.1 |
11.8 |
25.1 |
49.2 |
79.5 |
101.7 |
120.2 |
118.9 |
1996 |
5.9 |
11.5 |
24.6 |
48.4 |
76.9 |
103.9 |
120.9 |
125.4 |
1997 |
5.7 |
11.5 |
24.7 |
48.3 |
76.8 |
100.8 |
122.9 |
124.5 |
1998 |
5.6 |
10.9 |
23.2 |
45.3 |
72.3 |
95.5 |
114.0 |
123.5 |
1999 |
5.2 |
10.4 |
22.5 |
43.4 |
67.2 |
90.8 |
108.9 |
113.8 |
2000 |
5.2 |
10.4 |
21.8 |
41.7 |
66.2 |
86.4 |
106.8 |
114.0 |
2001 |
5.1 |
9.9 |
21.6 |
41.1 |
64.3 |
86.3 |
104.5 |
112.6 |
2002 |
4.7 |
9.5 |
20.5 |
39.8 |
63.7 |
85.4 |
104.1 |
111.1 |
2003 |
4.4 |
9.2 |
20.3 |
38.5 |
62.6 |
84.5 |
102.9 |
112.2 |
2004 |
4.0 |
8.9 |
19.9 |
39.3 |
62.1 |
84.8 |
103.1 |
112.0 |
Case rate = Cases per 1,000 juveniles in age group.
|
Age at Referral
In 2004, 57% of all delinquency cases processed by the juvenile courts involved youth age 15 or younger at the time of referral.
The proportion of cases involving juveniles age 15 or younger varied by offense: younger juveniles accounted for a smaller proportion of drug and public order cases than of person and property offense cases.
With the exception of 10- and 11- year-olds, age-specific case rates in 2004 were above the rates in 1985; however, in the 5 years between 2000 and 2004, age-specific case rates dropped 8% on average.
Offense profiles of delinquency cases by age group:
| Most serious offense |
Age 15 or younger |
Age 16 or older |
|
|
2004
|
|
|
Person |
27% |
20% |
Property |
38 |
34 |
Drugs |
9 |
16 |
Public order |
27 |
30 |
Total |
100% |
100% |
1985 |
Person |
16% |
15% |
Property |
64 |
56 |
Drugs |
5 |
9 |
Public order |
15 |
20 |
Total |
100% |
100% |
Note:
Detail may not total 100% because of
rounding.
|
Compared with the delinquency caseload involving older juveniles, the caseload of youth age 15 or younger in 2004 included larger proportions of person and property offense cases and smaller proportions of drug and public order offense cases.
Compared with 1985, the caseloads in 2004 of both older and younger juveniles involved greater proportions of person, public order, and drug offense cases and smaller proportions of property offense cases.
Although more 17-year-olds than 16- year-olds were arrested in 2004 (400,200 vs. 367,800), the number of juvenile court cases involving 17- year-olds (280,900) was lower than the number involving 16-year-olds (383,500). The explanation lies primarily in the fact that, in 13 States, 17-year-olds are excluded from the original jurisdiction of the juvenile court. In these States, all 17-yearolds are legally adults and are referred to criminal court rather than to juvenile court. Thus, far fewer 17- year-olds than 16-year-olds are subject to original juvenile court jurisdiction.
In 2004, the delinquency case rate for 17-year-olds (112.0) was nearly twice the rate for 14-year-olds (62.1) and almost 3 times the rate for 13- year-olds (39.3).
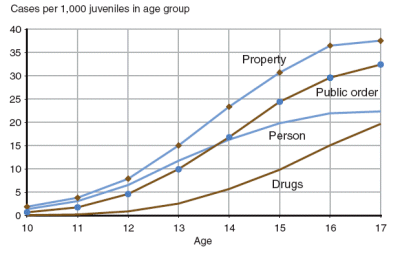
The largest increase in case rates between age 13 and age 17 was for drug offenses. The case rate for drug offenses for 17-year-old juveniles (19.7) was nearly 8 times the rate for 13-year-olds (2.6).
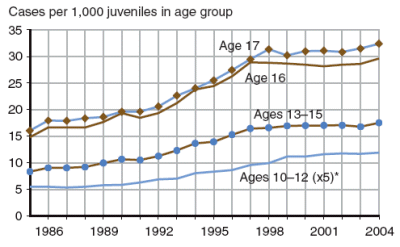
For public order offenses in 2004, the case rate for 17-year-olds (32.4) was more than 3 times the rate for 13- year-olds (9.9) and the property offense case rate for 17-year-olds (37.5) was more than double the rate for 13-year-olds (15.0).
For cases involving person offenses, the case rate for 17-year-olds (22.3) was nearly double the rate for 13- year-olds (11.8).
In 2004, delinquency case rates increased with the referral age of the juvenile
Case rates increased continuously with age for drug and public order offense cases, while person and property offense cases leveled off after age 16
Trends in case rates were generally similar across age groups between 1985 and 2004 for each general
offense category
Person offense case rates
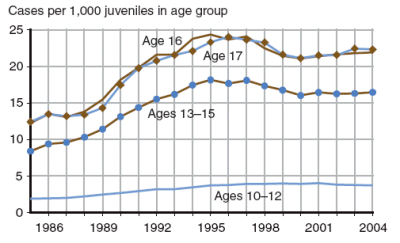
With the exception of 10–12 year olds, person offense case rates increased from 1985 into the mid 1990s and then declined through 2000. For youth ages 10–12, person offense case rates increased through 2001.
Between 2000 and 2004, person offense case rates decreased for youth ages 10–12, and increased for all other age groups.
Property offense case rates
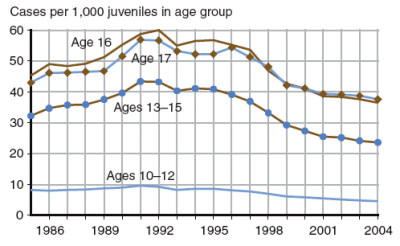
Across age groups, property offense case rates were considerably lower in 2004 than in 1985. In 2004, the case rate for juveniles ages 10–12 was 45% below the rate in 1985 and the rate for juveniles ages 13–15 was 27% below the rate in 1985.
Property offense case rates peaked in the early 1990s for all age groups, and then declined through 2004; property offense case rates were lower in 2004 than in 2000 for each age group.
Drug offense case rates
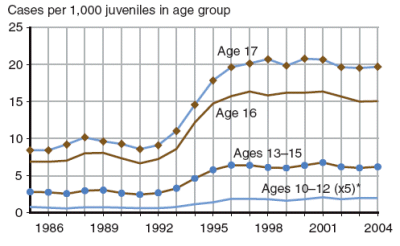
*Because of the relatively low volume of cases involving youth ages 10–12 for drug offenses and public order offenses, their case rates are inflated by a factor of 5 to display the trend over time.
Drug offense case rates increased dramatically for all age groups between 1991 and 1998—203% for juveniles ages 10–12, 151% for youth ages 13–15, 138% for 16-year-olds, and 142% for 17-year-olds.
Drug offense case rates in 2004 were considerably higher than the 1985 rates for all age groups.
Public order offense case rates
1 The upper age of juvenile court jurisdiction
is defined by statute in each State. See
appendix B, the “Glossary of Terms,” for a
more detailed discussion on upper age of juvenile
court jurisdiction. Case rates presented
in this Report control for State variations
in juvenile population.
2 The annual series of reports from the FBI,
Crime in the United States, provides information
on arrests in offense categories that have
become part of the common vocabulary of
criminal justice statistics. The Crime in the
United States series tracks changes in the
general nature of arrests through the use of
two indexes, the Violent Crime Index and the
Property Crime Index. Although they do not
contain all violent or all property offenses, the
indexes serve as a barometer of criminal activity
in the United States. The arrest trends
reported above are from Crime in the United
States 2004.
3 The percent change in the number of cases
disposed may not be equal to the percent
change in case rates because of the changing
size of the juvenile population.
(To be continued)
|


