Chapter 2
National Estimates of Delinquency Cases (continued)
Gender
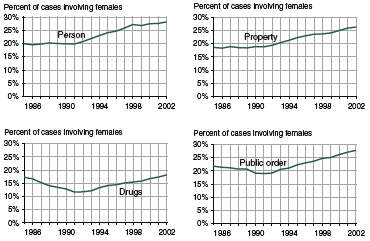
Overall, the female delinquency caseload grew at an average rate of 4% per year between 1985 and 2002, while the average rate increase was 2% per year for males.
Between 1985 and 2002, the relative increase in the female caseload out-paced that of the male caseload for person offenses (202% vs. 91%), public order offenses (171% vs. 97%), and drug offenses (171% vs. 156%).
Between 1985 and 2002, the male property caseload decreased 19%, while the number of property offense cases involving females increased 27%.
Between 1985 and 2002, the number of delinquency cases involving females increased 92% (from 220,600 to 423,100 cases); for males the increase was 29% (from 925,200 to 1,192,300 cases)
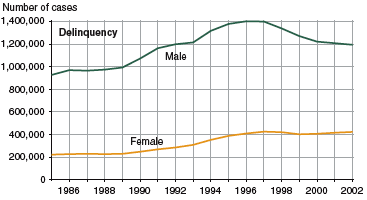
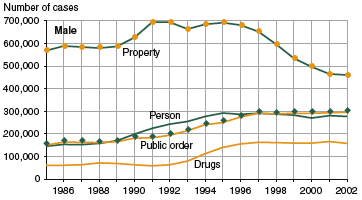
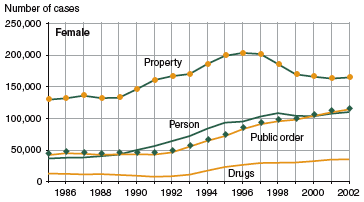
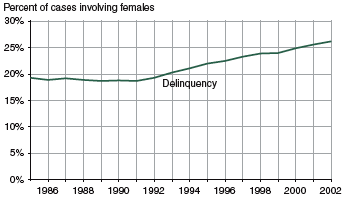
The proportion of the delinquency caseload involving females increased from 19% in 1985 to 26% in 2002
Offense profiles of delinquency cases for males and females:
| Most serious offense |
Age 15 or younger |
Age 16 or older |
|
| 2000 |
|
|
Person |
23% |
26% |
Property |
39 |
39 |
Drugs |
13 |
8 |
Public order |
25 |
27 |
Total |
100% |
100% |
1985 |
|
|
Person |
16% |
16% |
Property |
61 |
59 |
Drugs |
7 |
6 |
Public order |
16 |
19 |
Total |
100% |
100% |
Note: Detail may not total 100% because of rounding. |
-
Both male and female delinquency caseloads in 2002 had greater proportions of person, drug, and public order offense cases than in 1985 and smaller proportions of property offense cases.
-
In 2002, the female caseload contained a greater proportion of person and public order offenses and a smaller proportion of drug offenses than the male caseload.
-
The female and male caseload contained an equal proportion of property offenses in 2002. For both males and females, the property offense proportions of the delinquency caseloads were substantially less in 2002 than in 1985.
-
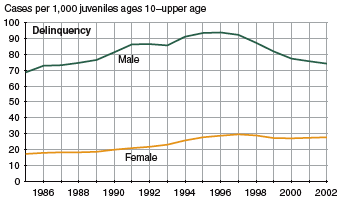
Overall, trends in delinquency case rates revealed similar patterns for males and females. For both groups, the case rate increased from 1985 into the mid-1990s. For males, the rate increased 36% to its peak in 1996 then fell 21% by 2002. The female rate grew 72% between 1985 and 1997 then dropped just 6% through 2002.
-
Male and female delinquency case rates converged between 1985 and 2002. In 1985, the delinquency case rate for males was almost 4 times greater than the rate for females; by 2002, the male rate was less than 3 times the female rate74.3 compared with 27.7.
-
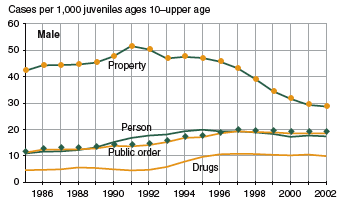
For all years, the largest gender disparity in offense-specific case rates was for drug offenses. In 2002, the drug offense case rate for males was more than 4 times greater than the rate for females.
-
Between 1998 and 2002, male case rates declined for each of the four general offense categories.
-
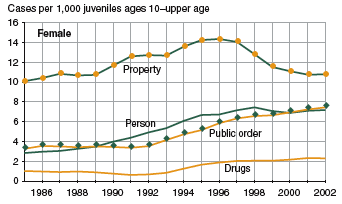
In contrast to male case rates, between 1998 and 2002, female case rates increased for drug and public order offenses, remained relatively unchanged for person offenses, and declined less than male rates for property offenses.
-
In 2002, female person offense case rates were at their highest level since 1998, while male rates fell 8% between 1998 and 2002.
-
As female property offense case rates decreased 16% between 1998 and 2002, rates for males decreased 26%.
-
Female drug offense case rates increased 12% between 1998 and 2002, while male rates decreased 7%.
-
Between 1998 and 2002, public order offense case rates for females increased 14% and male rates decreased 2%.
Although delinquency case rates are much higher for males than females, female rates increased more or decreased less than the male rates between 1985 and 2002
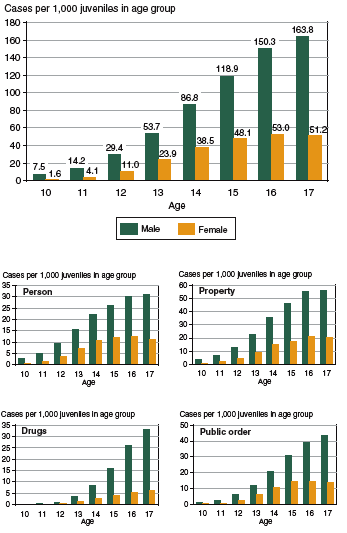
In 2002, the delinquency case rate for females peaked at age 16 while the male case rate increased through age 17
-
Delinquency case rates generally increased with age, but the increase was more pronounced for females than for males. In 2002, the average female case rate increase from one age group to the next was 77%, compared with a 59% average increase for males.
The difference between male and female delinquency case rates was greatest for the youngest and oldest age groups. In 2002, for youth ages 13 and 14, the male delinquency case rate was about twice the female rate; for 10-year-olds, the male rate was nearly 5 times the female rate, and for 17-year-olds, the male rate was more than 3 times the female rate.
In 2002, male case rates increased continuously through age 17 in all four delinquency offense categories.
-
For females, only the drug offense case rate increased through age 17 in 2002; female case rates for person, property, and public order offenses increased continuously through age 16 and then slightly declined.
Drug case rates in 2002 were highest for 17-year-olds of both sexes. The drug offense case rate for 17-year-old males was nearly 28 times the rate for 12-year-old males; among females, the drug offense case rate for 17-year-olds was more than 12 times the rate for 12-year-olds.
Across all age groups and offense categories, case rates for males exceed rates for females; however, since 1998, female rates for drug and public order offense cases increased while male rates leveled off
Person offense case rates
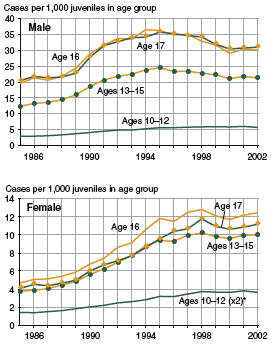
*Because of the relatively low volume of cases involving female youth ages 1012 for person offenses, their case rates are inflated by a factor of 2 to display the trend over time.
Between 1985 and 2002, male person offense case rates increased for all age groups: 92% for youth ages 1012, 73% for ages 1315, 54% for age 16, and 52% for age 17.
The age-specific trends between 1985 and 2002 in person offense case rates for females showed much greater increases than those for males. Case rates increased 157% for females ages 1012, 167% for those ages 1315, 165% for age 16, and 174% for age 17.
Property offense case rates
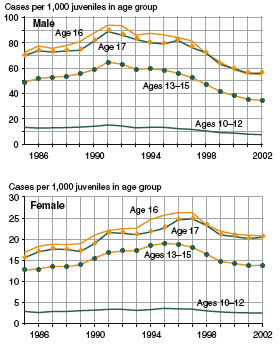
Property offense case rates increased for males across all age groups between 1985 and 1991 and then decreased through 2002 to their lowest level since 1985.
In contrast to males, age-specific property offense case rates for females were higher in 2002 than in 1985 for all age groups except ages 1012, whose rate decreased 13%.
For females ages 16 and 17, property offense case rates peaked in 1997; for age groups 1012 and 1315, the peak year was 1995. Following their peaks, female property case rates for all age groups dropped steadily through 2002.
Drug offense case rates
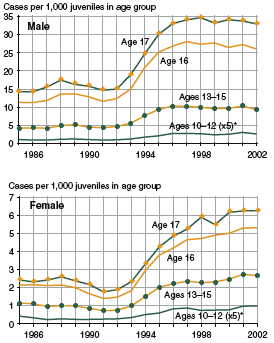
*Because of the relatively low volume of cases involving female youth ages 1012 for person offenses, their case rates are inflated by a factor of 2 to display the trend over time.
For males, drug offense case rates increased more than 120% for each age group between 1985 and 2002. Between 1991 and 2002, drug offense case rates for male youth ages 1012 increased 189%, while the rate increases for each of the other age groups averaged 120%.
Between 1985 and 2002, female drug offense case rates increased more than 130% for each age group; between 1991 and 2002, the increase was more than 250% for each age group.
Between 1998 and 2002, drug offense case rates for female youth ages 1012 increased 31%. Rates increased 18% for females ages 1315, 13% for 16-year-olds, and 6% for 17-year-olds.
Public order offense case rates
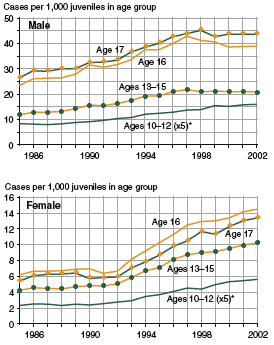
*Because of the relatively low volume of cases involving male and female youth ages 1012 for drug offenses and public order offenses, their case rates are inflated by a factor of 5 to display the trends over time.
Between 1985 and 2002, public order offense case rates for male youth ages 1012 increased 92%. Rates increased 76% for males ages 1315, 67% for 16-year-olds, and 65% for 17-year-olds.
-
With the exception of the 1012 age group, age-specific public order offense case rates for males have remained relatively stable since 1996. However, for males ages 1012, public order offense case rates increased 24% between 1996 and 2002.
Between 1991 and 2002, female public order offense case rates for youth ages 1012 increased 121%. Rates increased 113% for females ages 1315, 127% for 16-year-olds, and 129% for 17-year-olds.
Race
Percent change in number of cases by race, 19852002:
Most serious offense |
White4 |
Black |
Other races |
|
Delinquency |
31% |
65% |
89% |
Person |
120 |
99 |
173 |
Property |
18 |
7 |
35 |
Drugs |
149 |
196 |
183 |
Public order |
90 |
192 |
183 |
-
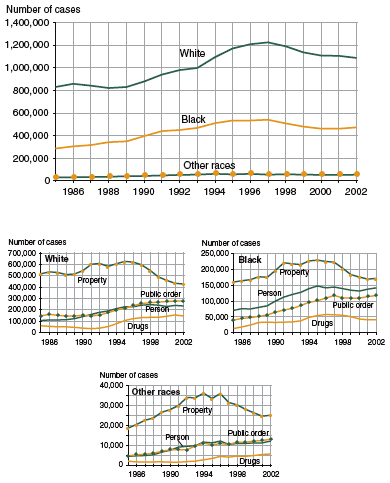
Although trends in the volume of cases differed somewhat across racial groups, the number of person, drug, and public order offense cases increased substantially between 1985 and 2002 for all three racial groups.
Offense profile of delinquency cases by race:
Most serious offense |
White |
Black |
Other races |
|
2002 |
Person |
22% |
30% |
22% |
Property |
39 |
36 |
45 |
Drugs |
13 |
9 |
10 |
Public order |
26 |
25 |
23 |
Total |
100% |
100% |
100% |
1985 |
Person |
13% |
25% |
15% |
Property |
62 |
56 |
63 |
Drugs |
7 |
5 |
7 |
Public order |
18 |
14 |
16 |
Total |
100% |
100% |
100% |
Note: Detail may not total 100% because of rounding. |
-
In 2002, the offense profile differed substantially from that of 1985 for all racial groups. Although a property offense was the most common charge involved in delinquency cases disposed for both years, the proportions of the caseloads that involved person or public order offenses were much larger in 2002 than in 1985 for all racial groups.
Between 1998 and 2002, the delinquency caseload decreased 9% for white juveniles, 7% for black juveniles, and 3% for youth of other races
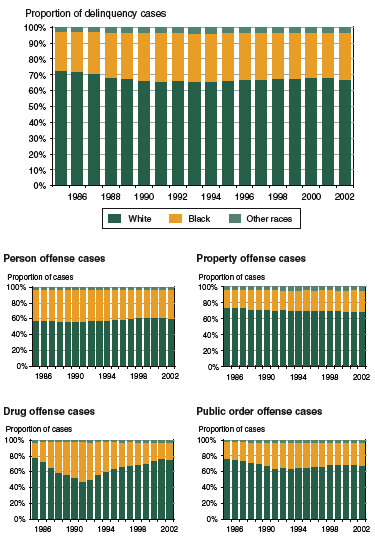
In 2002, more than two-thirds of all delinquency cases involved white youth: 60% of person offense cases, 68% of property offense cases, 76% of drug offense cases, and 68% of public order offense cases
-
In 2002, white youth made up 78% of the U.S. population under juvenile court jurisdiction, black youth 16%, and youth of other races 6%.
Racial profile of delinquency cases by offense:
Most serious offense |
White |
Black |
Other races |
Total |
|
2002 |
67% |
29% |
3% |
100% |
60 |
37 |
3 |
100 |
68 |
28 |
4 |
100 |
76 |
21 |
3 |
100 |
68 |
29 |
3 |
100 |
1985 |
Delinquency |
72% |
25% |
3% |
100% |
Person |
58 |
39 |
2 |
100 |
Property |
74 |
23 |
3 |
100 |
Drugs |
79 |
19 |
2 |
100 |
Public order |
77 |
21 |
2 |
100 |
Note: Detail may not total 100% because of rounding. |
-
Although white youth represented the largest share of the delinquency caseload, their relative contribution declined between 1985 and 2002, from 72% to 67%.
-
The proportion of delinquency cases involving black youth increased between 1985 and 2002 from 25% to 29%
-
Youth of other races made up less than 5% of delinquency cases processed for each year from 1985 through 2002.
-
The proportion of the drug offense caseload involving white youth decreased from 79% to 48% between 1985 and 1991 and then steadily increased to 76% in 2002. The proportion of drug offense cases involving black youth increased from 19% to 50% between 1985 and 1991 and then steadily decreased to 21% by 2002.
-
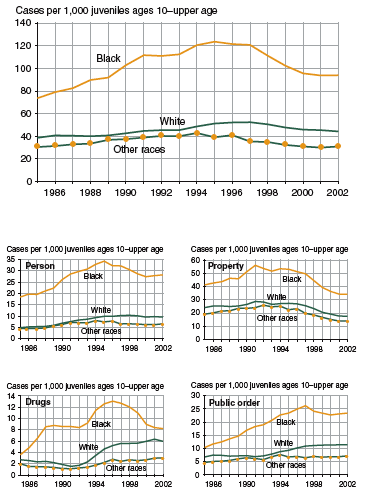
In 2002, the total delinquency case rate for black juveniles (94.0) was more than double the rate for white juveniles (44.4) and more than 3 times the rate for youth of other races (30.9).
-
For white juveniles, the delinquency case rate peaked in 1997 (52.4) then fell 15% by 2002; the rate for black juveniles in 2002 was down 24% from its 1995 peak (123.5). The delinquency case rate for youth of other races peaked in 1994 (42.9) then declined 28% by 2002.
-
Between 1985 and 2002, the person offense case rate increased more for white youth (93%) than for black youth (53%) or youth of other races (47%).
-
In 2002, the person offense case rate for black juveniles (28.2) was nearly 3 times the rate for white juveniles (9.5) and more than 4 times the rate for youth of other races (6.7).
-
Property offense case rates have declined since the early 1990s for all racial groups. Between 1991 and 2002, the rate for both white and black juveniles fell 39%, and the rate for youth of other races fell 42%. As a result, the property offense case rates in 2002 were lower than in 1985 for each racial group.
-
The drug offense case rate for black juveniles increased dramatically from 1985 to 1988, leveled off, then increased to reach a peak in 1996 (13.1) that was 263% above the rate in 1985 (3.6). Between 1996 and 2002, the drug offense case rate for black juveniles declined 37% (8.2) while the rate increased 14% for white juveniles and 9% for youth of other races.
-
Between 1985 and 2002, public order offense case rates increased 125% for black juveniles (10.4 vs. 23.4), 66% for white juveniles (6.9 vs. 11.4), and 52% for juveniles of other races (4.8 vs. 7.2).
Between 1997 and 2002, delinquency case rates declined for youth of all racial groups: 15% for white juveniles, 22% for black juveniles, and 12% for youth of other races
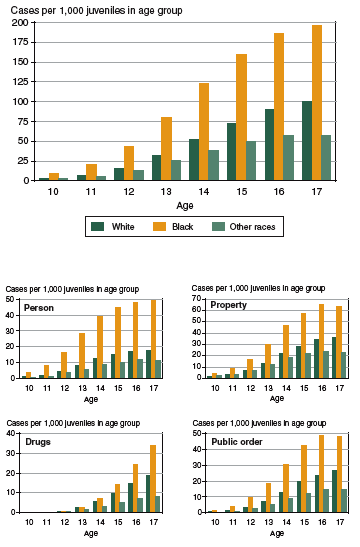
Case rates for juveniles generally increased with age regardless of race and offense category
-
In 2002, delinquency case rates increased sharply from age 10 to age 13 for all racial groups; the delinquency case rate for 13-year-olds was more than 8 times the rate for 10-year-olds for each racial group.
-
For each age group in 2002, the delinquency case rate for black juveniles was more than twice the rate for white juveniles and more than 3 times the rate for youth of other races.
-
Age-specific person offense rates for black juveniles in 2002 averaged more than 3 times the rates for white juveniles and nearly 5 times the rates for youth of other races.
-
In 2002, the person offense case rate for 16-year-olds within each racial group was more than twice the rate for 13-year-olds.
-
Age-specific case rates for property offenses in 2002 were higher than the rates for other offense categories for all racial groups.
-
In 2002, property offense case rates for black juveniles were more than twice the rates for white juveniles or youth of other races for each age group.
-
Age-specific drug offense case rates in 2002 were comparable for white juveniles and black juveniles through age 13. After age 13, the racial disparity in drug offense case rates increased so that by age 17 the black drug offense case rate was nearly 2 times the white rate and more than 4 times the rate of other races.
-
In 2002, the drug offense case rate among 16-year-olds was 10 times the rate among 13-year-olds for black youth, compared with 6 times for white youth and 4 times for youth of other races.
-
Within each age group in 2002, the public order offense case rate for black juveniles was more than twice the rate for white youth and nearly 4 times the rate for youth of other races.
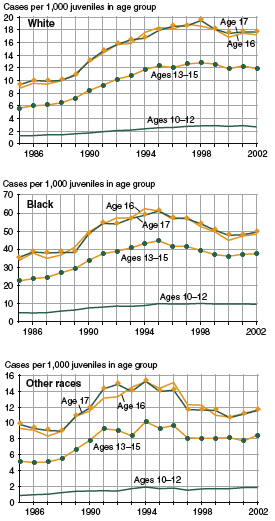
With the exception of property offenses, case rates in 2002 were higher than those in 1985 for all age groups within each racial category
Person offense case rates
-
For all years between 1985 and 2002, person offense case rates for blacks were well above those for other racial groups. In 2002, age-specific person offense case rates for black youth were 3 to 4 times higher than the corresponding rates for white youth and 4 to 6 times higher than those for youth of other races.
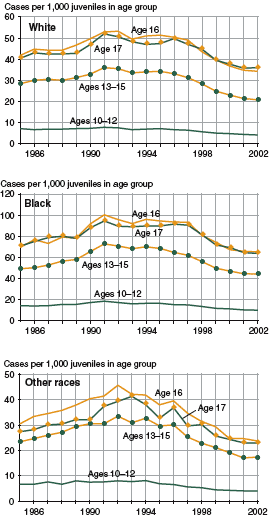
Property offense case rates
-
Between 1998 and 2002, age-specific property offense case rates decreased for all racial groups to a level lower than that of 1985.
Drug offense case rates
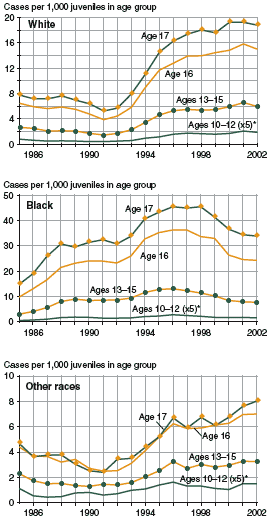
*Because of the relatively low volume of cases involving youth of all races ages 1012 for drug offenses and public order offenses, their case rates are inflated by a factor of 5 to display the trends over time.
-
Drug offense case rates for black youth generally increased for all age groups through the mid 1990s then declined steadily through 2002. For white youth and youth of other races, rates declined for all age groups through the early 1990s then increased to their current levels.
Public order offense case rates
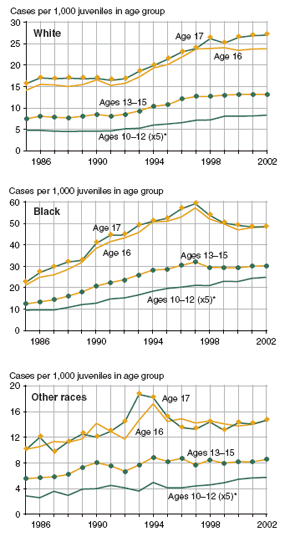
*Because of the relatively low volume of cases involving youth of all races ages 1012 for drug offenses and public order offenses, their case rates are inflated by a factor of 5 to display the trends over time.
- Across age groups, public order offense case rates for black youth more than doubled between 1985 and 2002. During the same time period, the rate for white youth increased more than 65% for each age group.
Source of Referral
-
Delinquency cases can be referred to court intake by a number of sources, including law enforcement agencies, social service agencies, schools, parents, probation officers, and victims.
-
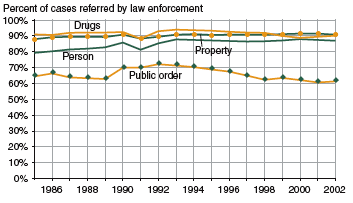
Law enforcement agencies were the primary source of delinquency referrals for each year between 1985 and 2002.
-
In 2002, 82% of all delinquency cases were referred by law enforcement; however, there were variations across offense categories.
Law enforcement agencies referred 91% of property cases, 90% of drug law violation cases, 87% of person offense cases, and 61% of public order offense cases in 2002.
-
For each year between 1985 and 2002, public order offense cases had the smallest proportion of cases referred to court by law enforcement. This may be attributed in part to the fact that this offense category contains probation violations and contempt-of-court cases, which are most often referred by court personnel.
-
Compared with 1985, law enforcement referred a larger proportion of person and property offense cases in 2002 and a smaller proportion of public order offense cases.
Law enforcement agencies are the primary source of delinquency referrals to juvenile court
|
|
Data Table |
|
Total |
Person |
Property |
Drugs |
Public order |
|
1985 |
83% |
79% |
88% |
91% |
64% |
1986 |
84 |
80 |
89 |
91 |
66 |
1987 |
84 |
82 |
89 |
92 |
64 |
1988 |
84 |
82 |
89 |
92 |
63 |
1989 |
84 |
83 |
89 |
92 |
63 |
1990 |
86 |
86 |
91 |
92 |
70 |
1991 |
84 |
81 |
88 |
88 |
70 |
1992 |
86 |
85 |
90 |
93 |
72 |
1993 |
87 |
88 |
91 |
94 |
71 |
1994 |
87 |
87 |
91 |
94 |
70 |
1995 |
86 |
87 |
91 |
93 |
69 |
1996 |
86 |
87 |
91 |
93 |
67 |
1997 |
85 |
87 |
91 |
92 |
65 |
1998 |
84 |
87 |
91 |
92 |
62 |
1999 |
84 |
87 |
91 |
90 |
63 |
2000 |
83 |
88 |
91 |
89 |
62 |
2001 |
83 |
88 |
91 |
90 |
61 |
2002 |
82 |
87 |
91 |
90 |
61 |
4 Throughout this Report, juveniles of Hispanic
ethnicity can be of any race; however, most
are included in the white racial category.
|


