Juvenile arrests disproportionately involved minorities
The racial composition of the juvenile population in 2003 was 78% white, 16% black, 4% Asian/Pacific Islander, and 1% American Indian. Most Hispanics (an ethnic designation, not a race) were classified as white. In contrast to their representation in the population, black youth were overrepresented in juvenile arrests for violent crimes, and, to a lesser extent, property crimes. Of all juvenile arrests for violent crimes in 2003, 53% involved white youth, 45% involved black youth, 1% involved Asian youth, and 1% involved American Indian youth. For property crime arrests, the proportions were 69% white youth, 28% black youth, 2% Asian youth, and 1% American Indian youth.
| Most Serious Offense | Black Proportion of Juvenile Arrests in 2003 | |
|---|---|---|
| Murder | 48% | |
| Forcible rape | 33 | |
| Robbery | 63 | |
| Aggravated assault | 38 | |
| Burglary | 26 | |
| Larceny-theft | 27 | |
| Motor vehicle theft | 40 | |
| Weapons | 32 | |
| Drug abuse violations | 26 | |
| Runaways | 20 | |
| Vandalism | 18 | |
| Liquor laws | 4 | |
|
Data source: Crime in the United States 2003, table 43. |
||
The Violent Crime Index arrest rate (i.e., arrests per 100,000 juveniles in the racial group) in 2003 for black juveniles (752) was more than 4 times the rates for American Indian juveniles (172) and white juveniles (186) and more than 8 times the rate for Asian juveniles (88). For Property Crime Index arrests, the rate for black juveniles (2,352) was about double the rates for American Indian juveniles (1,366) and white juveniles (1,237) and nearly 4 times the rate for Asian juveniles (614).
Over the period from 1980 through 2003, the black-to-white disparity in juvenile arrest rates for violent crimes declined. In 1980, the black juvenile Violent Crime Index arrest rate was 6.3 times the white rate; in 2003, the rate disparity had declined to 4.0. This reduction in arrest rate disparities between 1980 and 2003 was primarily the result of the decline in black- to-white arrest rate disparities for robbery (from 11.5 in 1980 to 8.4 in 2003), because the disparity in the arrest rates for aggravated assault changed little (3.2 vs. 3.1).
| Declines in juvenile arrest rates from the mid-1990s through 2003 were
substantial for both white youth and black youth
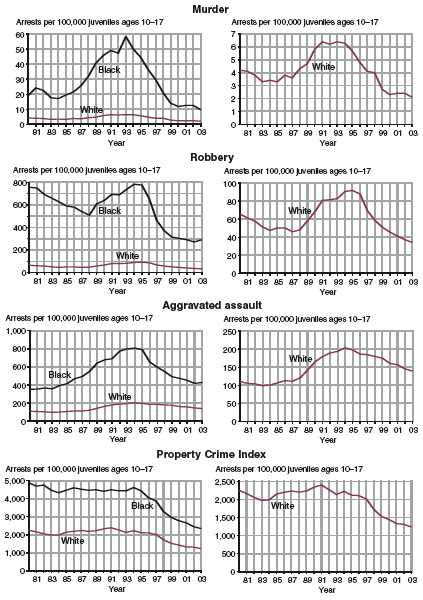
Data source: Analysis of arrest data from the FBI and population data from the U.S. Bureau of the Census and the National Center for Health Statistics. [See data source note for detail.] |
|
|
||
|
|
| State variations in juvenile arrest rates may reflect differences in juvenile law-violating behavior, police behavior, and/or community standards
* Throughout this Bulletin, juvenile arrest rates are calculated by dividing the number of arrests of persons ages 10–17 by the number of persons ages 10–17 in the population. In this table only, arrest rate is defined as the number of arrests of persons under age 18 for every 100,000 persons ages 10–17. Juvenile arrests (arrests of youth under age 18) reported at the state level in Crime in the United States cannot be disaggregated into more detailed age categories so that the arrest of persons under age 10 can be excluded in the rate calculation. Therefore, there is a slight inconsistency in this table between the age range for the arrests (birth through age 17) and the age range for the population (ages 10–17) that are the basis of a state's juvenile arrest rates. This inconsistency is slight because just 1% of all juvenile arrests involved youth under age 10. This inconsistency is preferable to the distortion of arrest rates that would be introduced were the population base for the arrest rate to incorporate the large volume of children under age 10 in a state's population.
NA = Crime in the United States 2003 reported no arrest counts for the District of Columbia or Nevada. Interpretation cautions: Arrest rates are calculated by dividing the number of youth arrests made in the year by the number of youth living in reporting jurisdictions. While juvenile arrest rates in part reflect juvenile behavior, many other factors can affect the size of these rates. For example, jurisdictions that arrest a relatively large number of nonresident juveniles would have higher arrest rates than jurisdictions where resident youth behave in an identical manner. Therefore, jurisdictions that are vacation destinations or regional centers for economic activity may have arrest rates that reflect more than the behavior of their resident youth. Other factors that influence the magnitude of arrest rates in a given area include the attitudes of its citizens toward crime, the policies of the jurisdiction's law enforcement agencies, and the policies of other components of the justice system. Consequently, comparisons of juvenile arrest rates across states, while informative, should be made with caution. In most states, not all law enforcement agencies report their arrest data to the FBI. Rates for these states are necessarily based on partial information. If the reporting law enforcement agencies in these states are not representative of the entire state, then the rates will be biased. Therefore, reported arrest rates for states with less than complete reporting coverage may not be accurate. Data source: Analysis of arrest data from the FBI's Crime in the United States 2003 (Washington, DC: U.S. Government Printing Office, 2004), tables 5 and 69, and population data from the National Center for Health Statistics' Estimates of the July 1, 2000–July 1, 2003, United States Resident Population From the Vintage 2003 Postcensal Series by Year, County, Age, Sex, Race, and Hispanic Origin [machine-readable data files available online at http://www.cdc.gov/nchs/about/major/dvs/popbridge/popbridge.htm, released 9/14/2004]. |
||||||||||||||||||||||||||||||||||||||||||||||||||||||||||||||||||||||||||||||||||||||||||||||||||||||||||||||||||||||||||||||||||||||||||||||||||||||||||||||||||||||||||||||||||||||||||||||||||||||||||||||||||||||||||||||||||||||||||||||||||||||||||||||||||||||||||||||||||||||||||||||||||||||||||||||||||||||||||||||||||||||||||||||||||||||||||||||||||||||||||||||||||||||||||||||||||||||||||||||||||||||||||||||||||||||||||||||||||||||||||||||||||||||||||||||||||||||||||||||||||||||||||||||||||||||||||||||||||||||||||||||||||||||||||||||||||||||||||||||||||||||||||||||||||||||||||||||||||||||||||
| Previous | Contents | Next |
|
|
|
| Juvenile Arrests 2003 | |
